Fig. 2
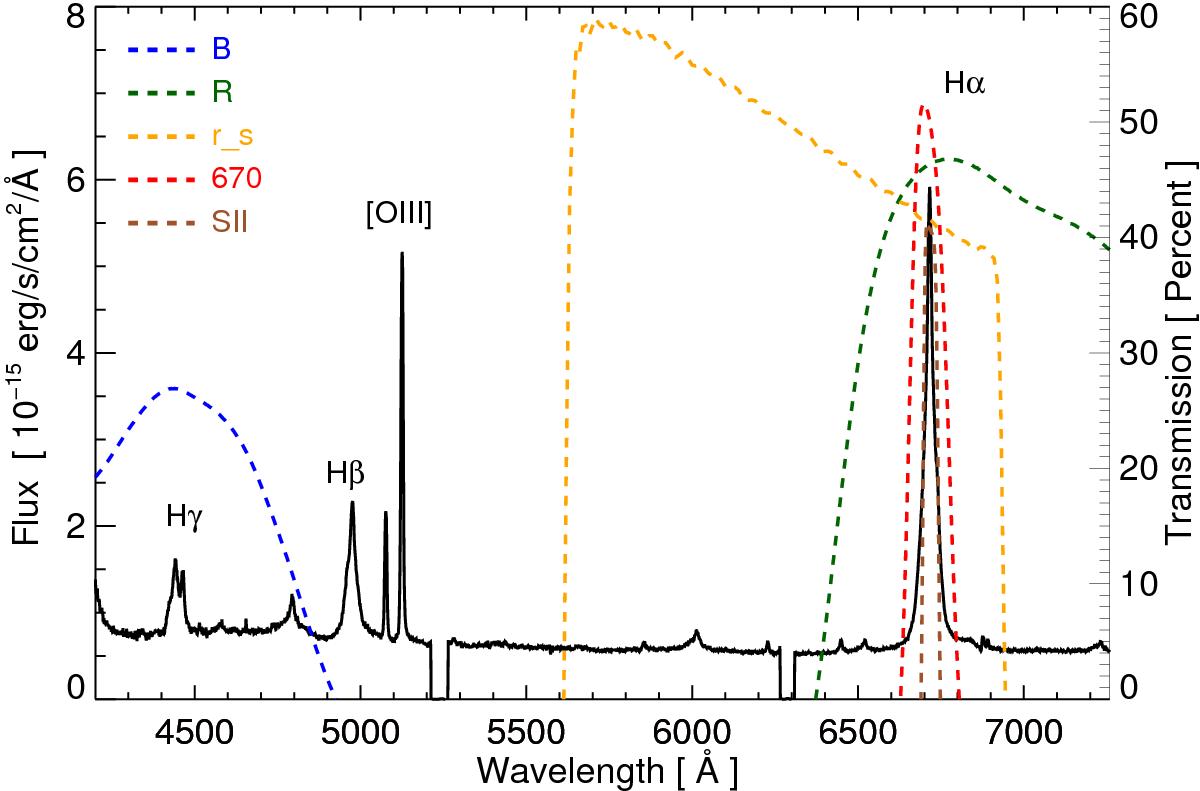
SALT spectrum of PGC 50427. For illustration, the band passes of the filters used for the photometric monitoring are shown (blue B-band, green R-band, orange rs-band, red 670-band, and brown for SII-band). The NB 670 and SII catches the redshifted Hα line, its flux is composed by the contribution of about 85% Hα line and 15% continuum. We note that for actual flux calculations the filter curves are convolved with the quantum efficiency of the Alta U16 and SBIG STL CCDs cameras.
Current usage metrics show cumulative count of Article Views (full-text article views including HTML views, PDF and ePub downloads, according to the available data) and Abstracts Views on Vision4Press platform.
Data correspond to usage on the plateform after 2015. The current usage metrics is available 48-96 hours after online publication and is updated daily on week days.
Initial download of the metrics may take a while.