Fig. 12
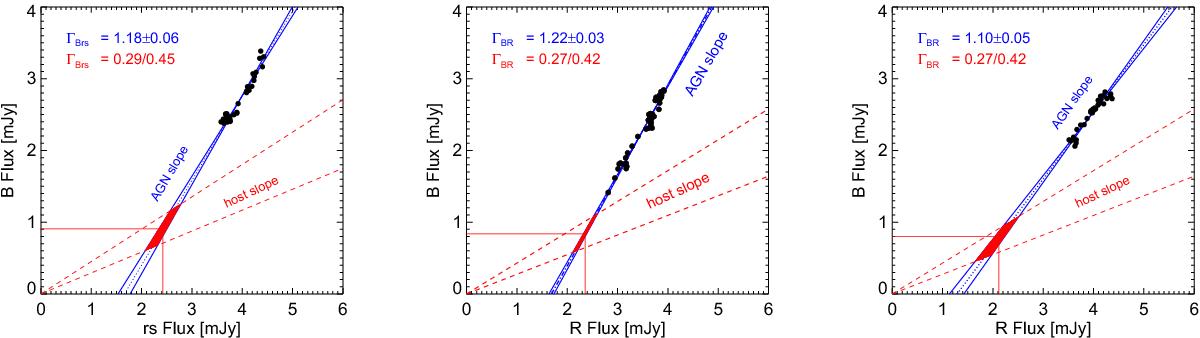
Flux variation gradient diagrams for 2011 (left), 2013 (middle) and 2014 (right) campaigns. The solid lines delineate the bisector regression model yielding the range of the AGN slope. The dashed lines indicate the range of host slopes determined by Sakata et al. (2010) for 11 nearby AGN. The intersection between the host galaxy and AGN slope (red area) gives the host galaxy flux at the time of the campaign in both bands.
Current usage metrics show cumulative count of Article Views (full-text article views including HTML views, PDF and ePub downloads, according to the available data) and Abstracts Views on Vision4Press platform.
Data correspond to usage on the plateform after 2015. The current usage metrics is available 48-96 hours after online publication and is updated daily on week days.
Initial download of the metrics may take a while.