Fig. 10
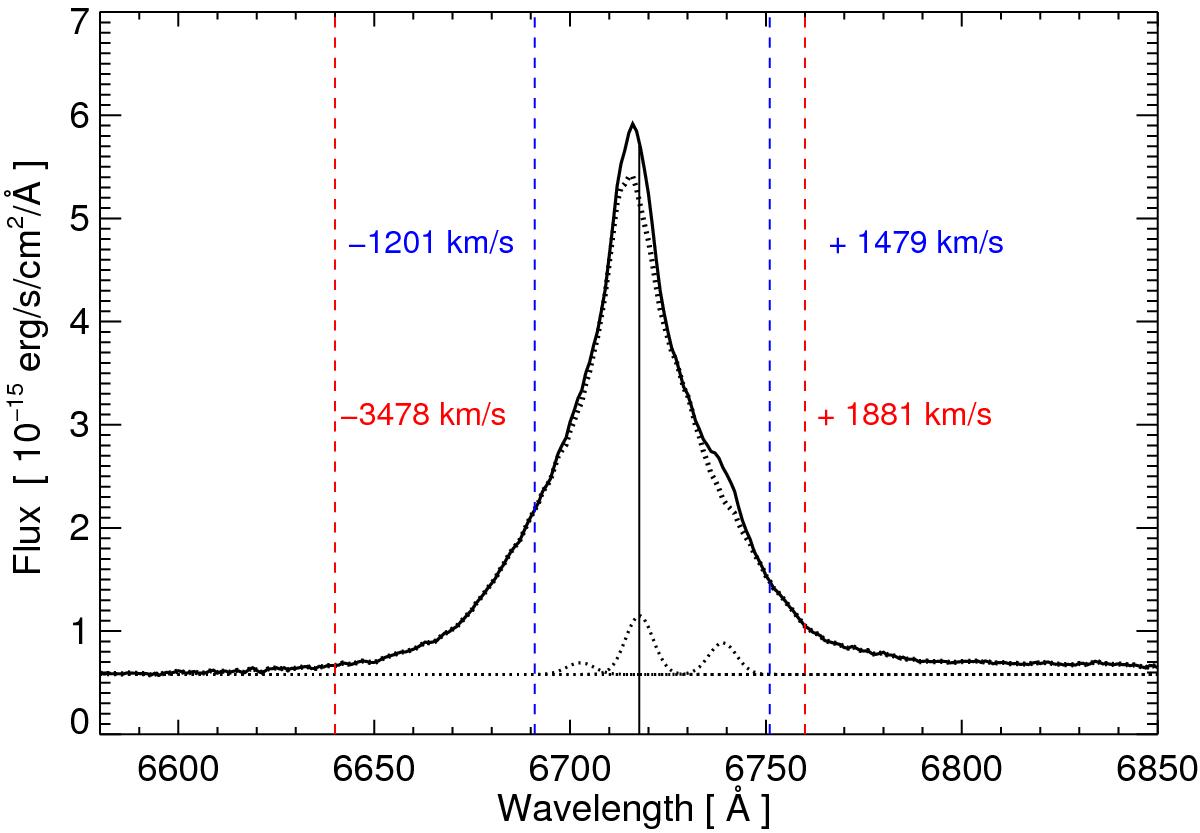
SALT spectrum of PGC 50427, zoomed onto the Hα line. The dotted black curve represents the spectrum after subtracting the narrow [NII]λλ6548, 6583 emission lines. The narrow Hα and [NII] models are shown in dotted lines at the bottom of the Hα profile. The NB 670 and SII filters efectively covers the line between velocities −3478 km s-1 and +1881 km s-1 (red dotted lines) and −1201 km s-1 and +1479 km s-1 (blue dotted lines) respectively.
Current usage metrics show cumulative count of Article Views (full-text article views including HTML views, PDF and ePub downloads, according to the available data) and Abstracts Views on Vision4Press platform.
Data correspond to usage on the plateform after 2015. The current usage metrics is available 48-96 hours after online publication and is updated daily on week days.
Initial download of the metrics may take a while.