Fig. 4
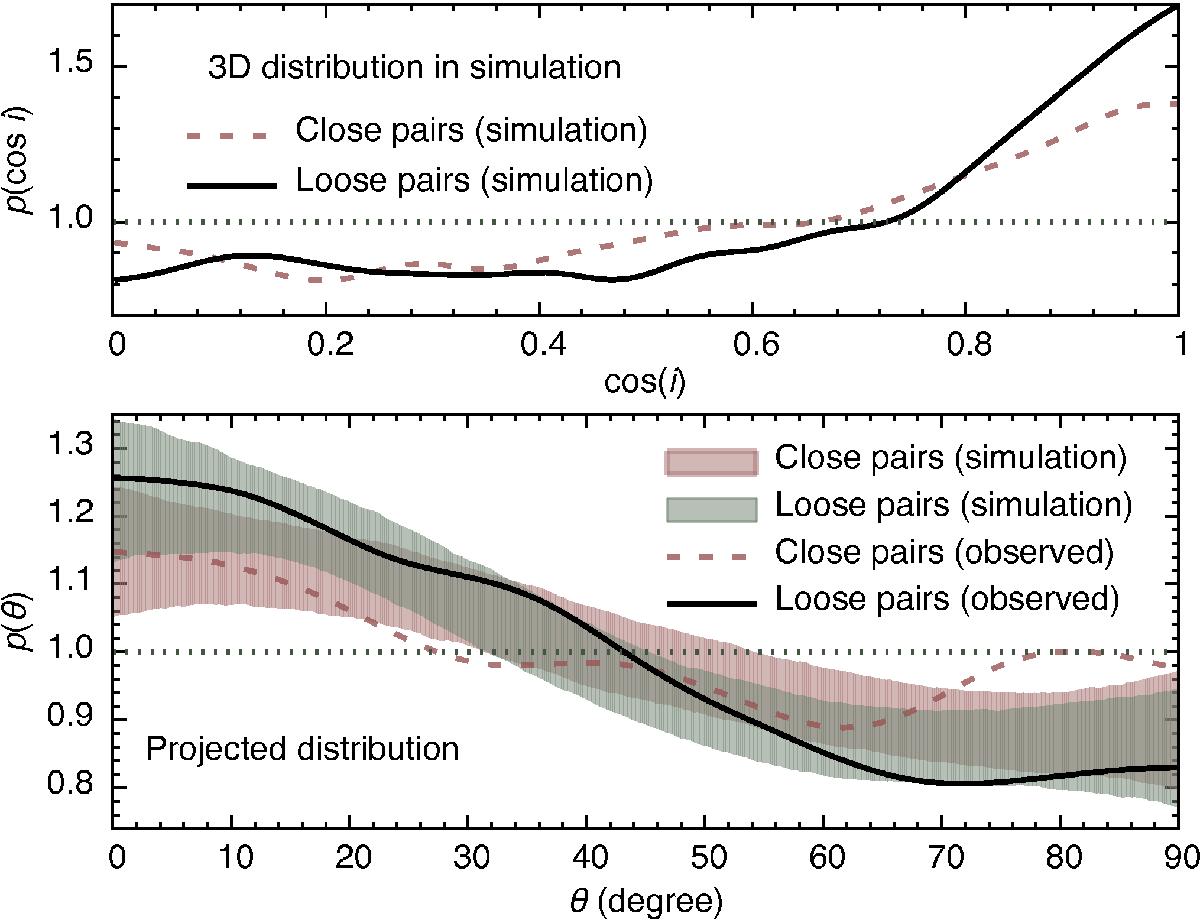
Upper panel: alignment of close and loose galaxy pairs with the host filaments in the Millennium simulation; i denotes the real-space angle between a filament and a galaxy pair. Lower panel: angle distribution for close and loose pairs in the SDSS data (solid and dashed lines; same as in Fig. 2) compared to the sky projection of a model distribution, in which the real-space alignment between pairs and filaments of the Millennium simulation (shown in the upper panel) is ascribed to the actual SDSS filaments. The modelled distributions are shown as filled regions corresponding to the 95% confidence level.
Current usage metrics show cumulative count of Article Views (full-text article views including HTML views, PDF and ePub downloads, according to the available data) and Abstracts Views on Vision4Press platform.
Data correspond to usage on the plateform after 2015. The current usage metrics is available 48-96 hours after online publication and is updated daily on week days.
Initial download of the metrics may take a while.