Fig. 3
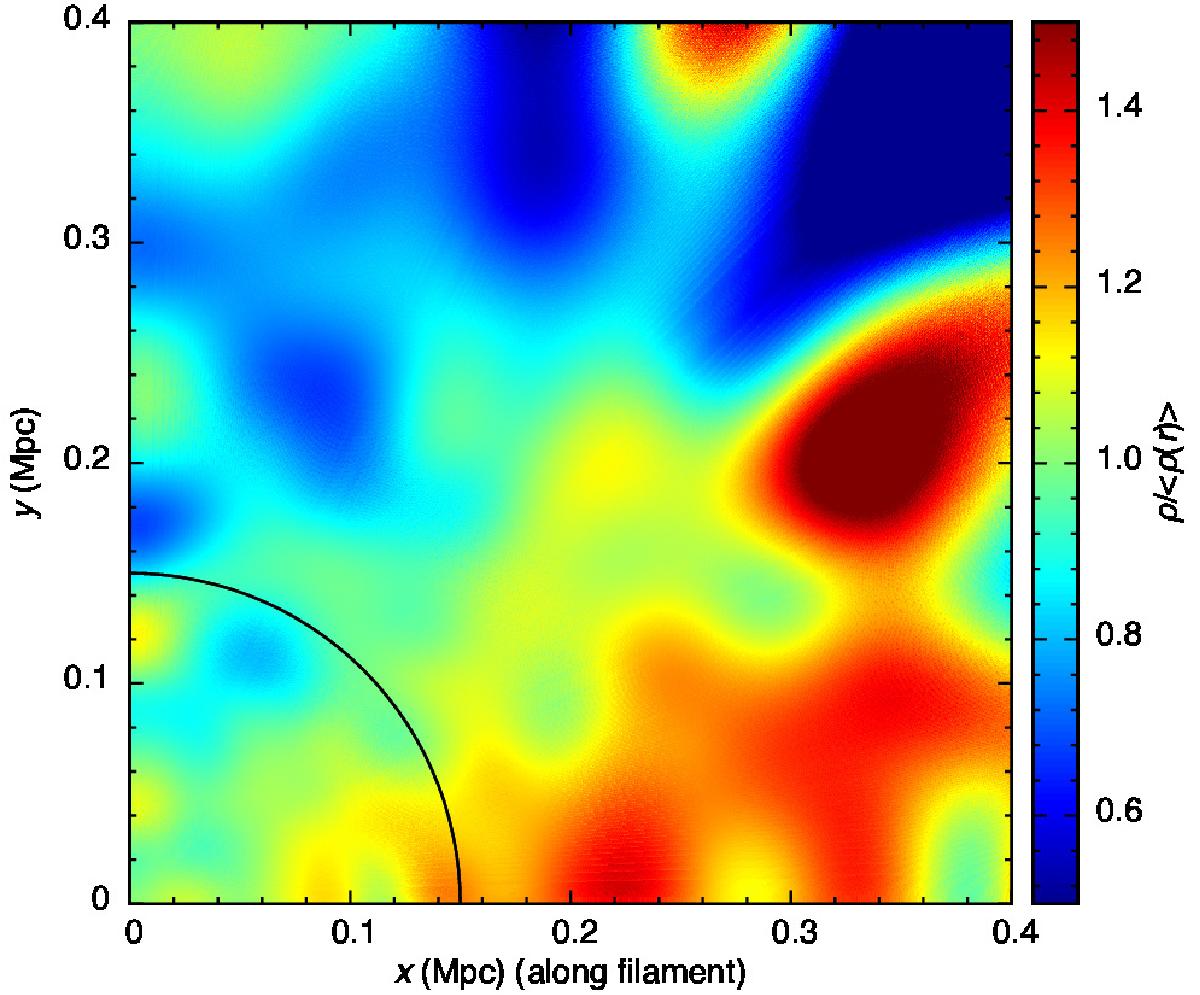
Distribution of stacked galaxy pairs in the plane of the sky. Galaxy pairs are stacked based on the orientation of the host filaments (represented by the x-axis); the centre point of each pair matches with the origin of the coordinate axes. The densities are shown in units of spherically averaged mean number densities. The black solid line shows the demarcation of close and loose pairs.
Current usage metrics show cumulative count of Article Views (full-text article views including HTML views, PDF and ePub downloads, according to the available data) and Abstracts Views on Vision4Press platform.
Data correspond to usage on the plateform after 2015. The current usage metrics is available 48-96 hours after online publication and is updated daily on week days.
Initial download of the metrics may take a while.