Fig. 2
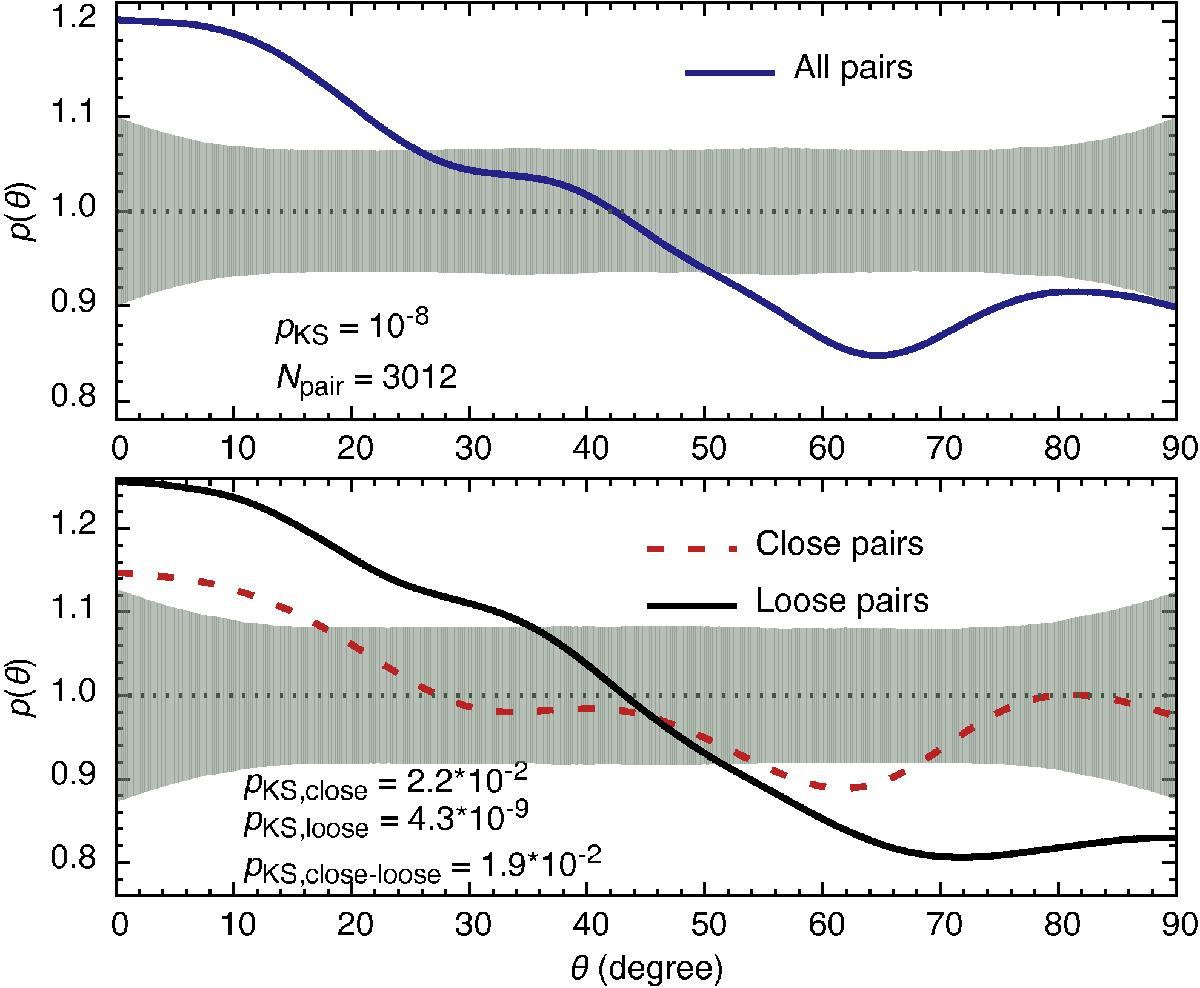
Upper panel: probability distribution function (blue solid line) of the projected angles (in the plane of the sky) between galaxy pairs and their host filaments. The KS test probability that the sample is drawn from a uniform distribution is 10-8. The filled area shows the 95% confidence region for a randomised distribution of 3012 pairs. Lower panel: same as in the upper panel for two equal-sized subsamples: close pairs (dsep< 0.3 Mpc; red dashed line) and loose pairs (dsep> 0.3 Mpc; black solid line).
Current usage metrics show cumulative count of Article Views (full-text article views including HTML views, PDF and ePub downloads, according to the available data) and Abstracts Views on Vision4Press platform.
Data correspond to usage on the plateform after 2015. The current usage metrics is available 48-96 hours after online publication and is updated daily on week days.
Initial download of the metrics may take a while.