Free Access
Fig. 2
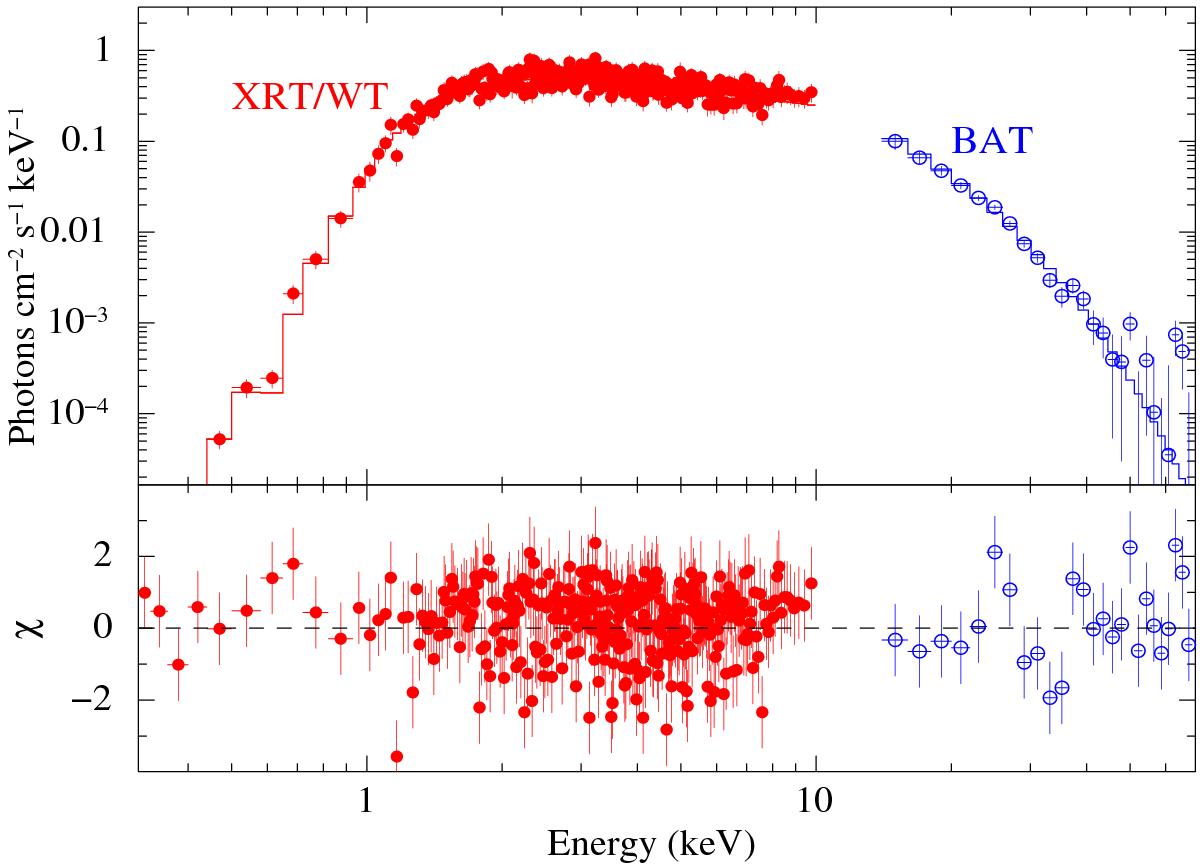
Spectroscopy of the 2014 October 10 outburst of IGR J17544−2619. Top panel: simultaneous XRT/WT data (filled red circles) and BAT data (empty blue circles) fit with an absorbed power law with a high energy exponential cut-off model. Bottom panel: residuals of the fit (in units of standard deviations).
Current usage metrics show cumulative count of Article Views (full-text article views including HTML views, PDF and ePub downloads, according to the available data) and Abstracts Views on Vision4Press platform.
Data correspond to usage on the plateform after 2015. The current usage metrics is available 48-96 hours after online publication and is updated daily on week days.
Initial download of the metrics may take a while.