Fig. 1
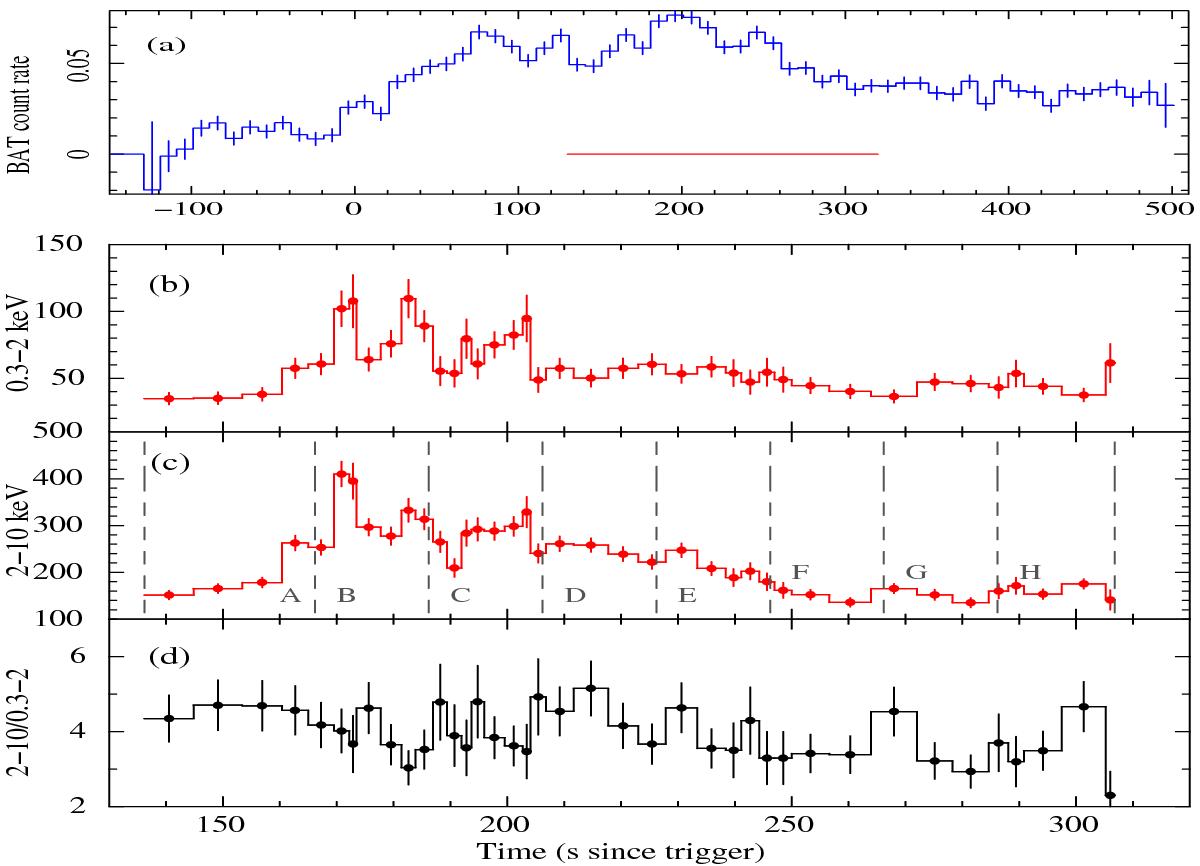
Light curves of the 2014 October 10 outburst of IGR J17544 −2619. a) BAT (14−150 keV, 10 s binning): the red horizontal line marks the XRT data span; b) XRT soft band (0.3−2 keV, at 30 counts bin-1); c) XRT hard band (2−10 keV, at 30 counts bin-1); d) XRT hardness ratio (2−10 keV/0.3−2 keV). The dashed vertical lines mark the time selections for BAT and XRT spectroscopy (Sect. 3.1).
Current usage metrics show cumulative count of Article Views (full-text article views including HTML views, PDF and ePub downloads, according to the available data) and Abstracts Views on Vision4Press platform.
Data correspond to usage on the plateform after 2015. The current usage metrics is available 48-96 hours after online publication and is updated daily on week days.
Initial download of the metrics may take a while.