Fig. 5
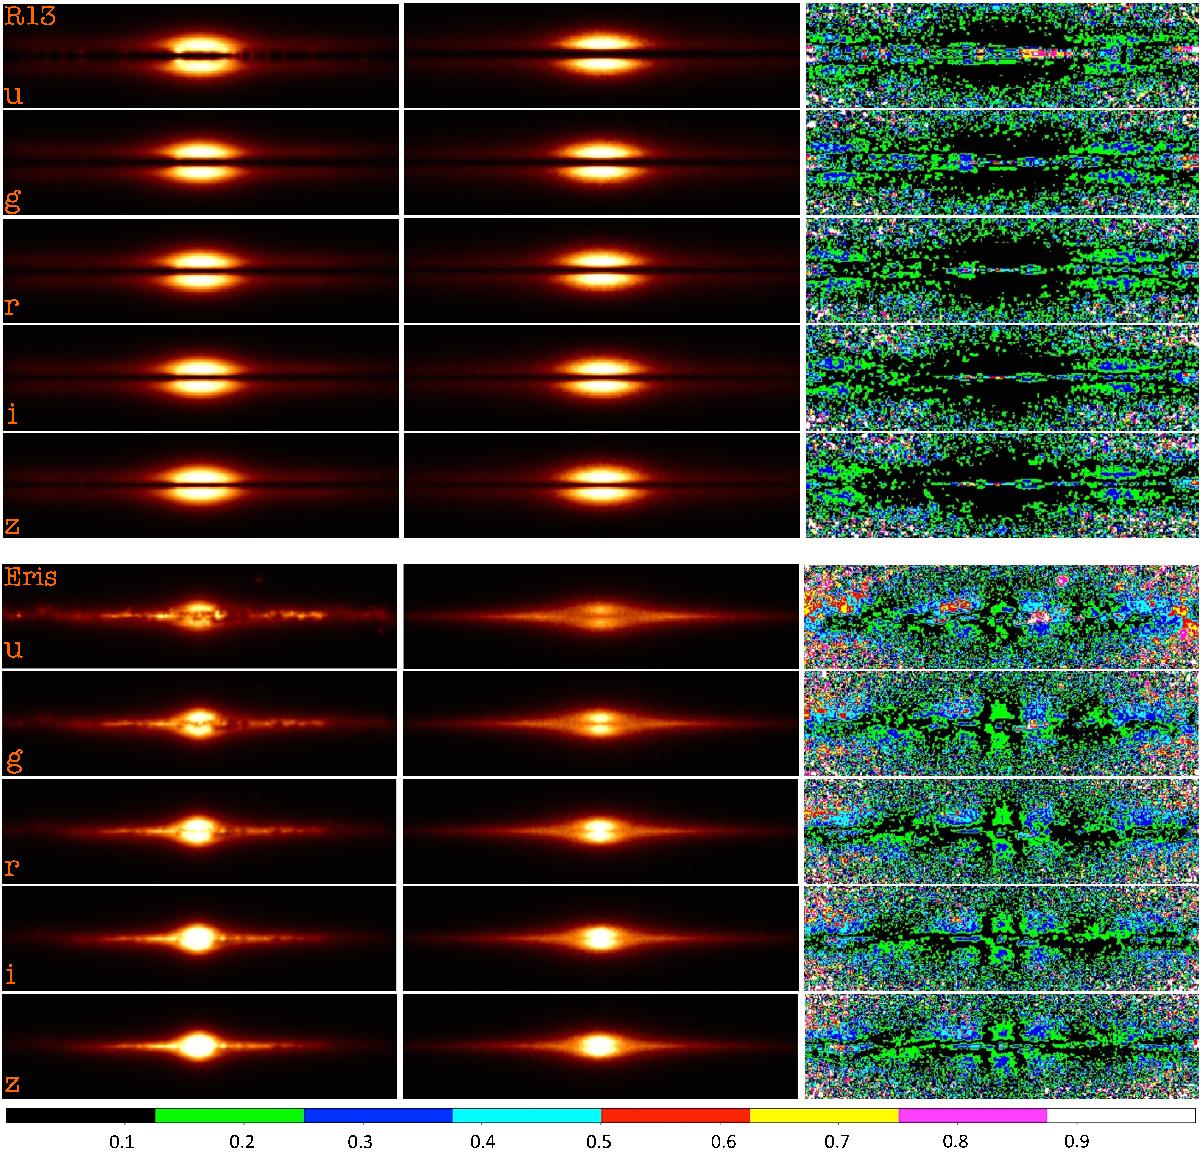
Results of the FitSKIRT radiative transfer fits for the R13 galaxy, looking at the head of the bar (upper half), and for the Eris galaxy (lower half). Left column: reference images produced by SKIRT in each of the u, g, r, i, and z bands. Middle column: corresponding fit obtained with FitSKIRT. Right column: residual images showing the relative deviation between the fit and the reference image. The colour bar at the bottom presents the scale of the deviation in the residual images.
Current usage metrics show cumulative count of Article Views (full-text article views including HTML views, PDF and ePub downloads, according to the available data) and Abstracts Views on Vision4Press platform.
Data correspond to usage on the plateform after 2015. The current usage metrics is available 48-96 hours after online publication and is updated daily on week days.
Initial download of the metrics may take a while.