Free Access
Fig. 4
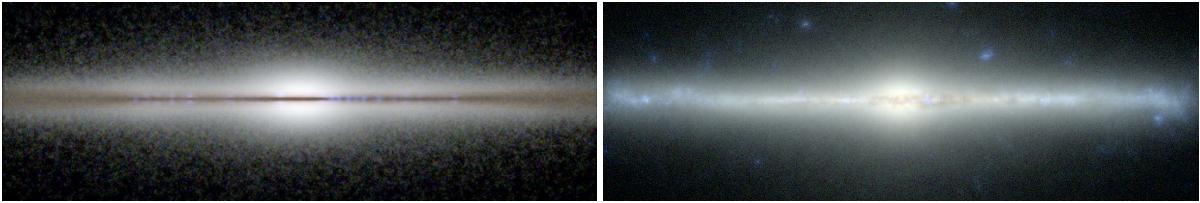
Mock edge-on views for the R13 galaxy, looking at the head of the bar (left panel), and for the Eris galaxy (right panel). The three-colour images are based on the r, g and u band images produced by the SKIRT radiative transfer code.
This figure is made of several images, please see below:
Current usage metrics show cumulative count of Article Views (full-text article views including HTML views, PDF and ePub downloads, according to the available data) and Abstracts Views on Vision4Press platform.
Data correspond to usage on the plateform after 2015. The current usage metrics is available 48-96 hours after online publication and is updated daily on week days.
Initial download of the metrics may take a while.