Free Access
Fig. 8
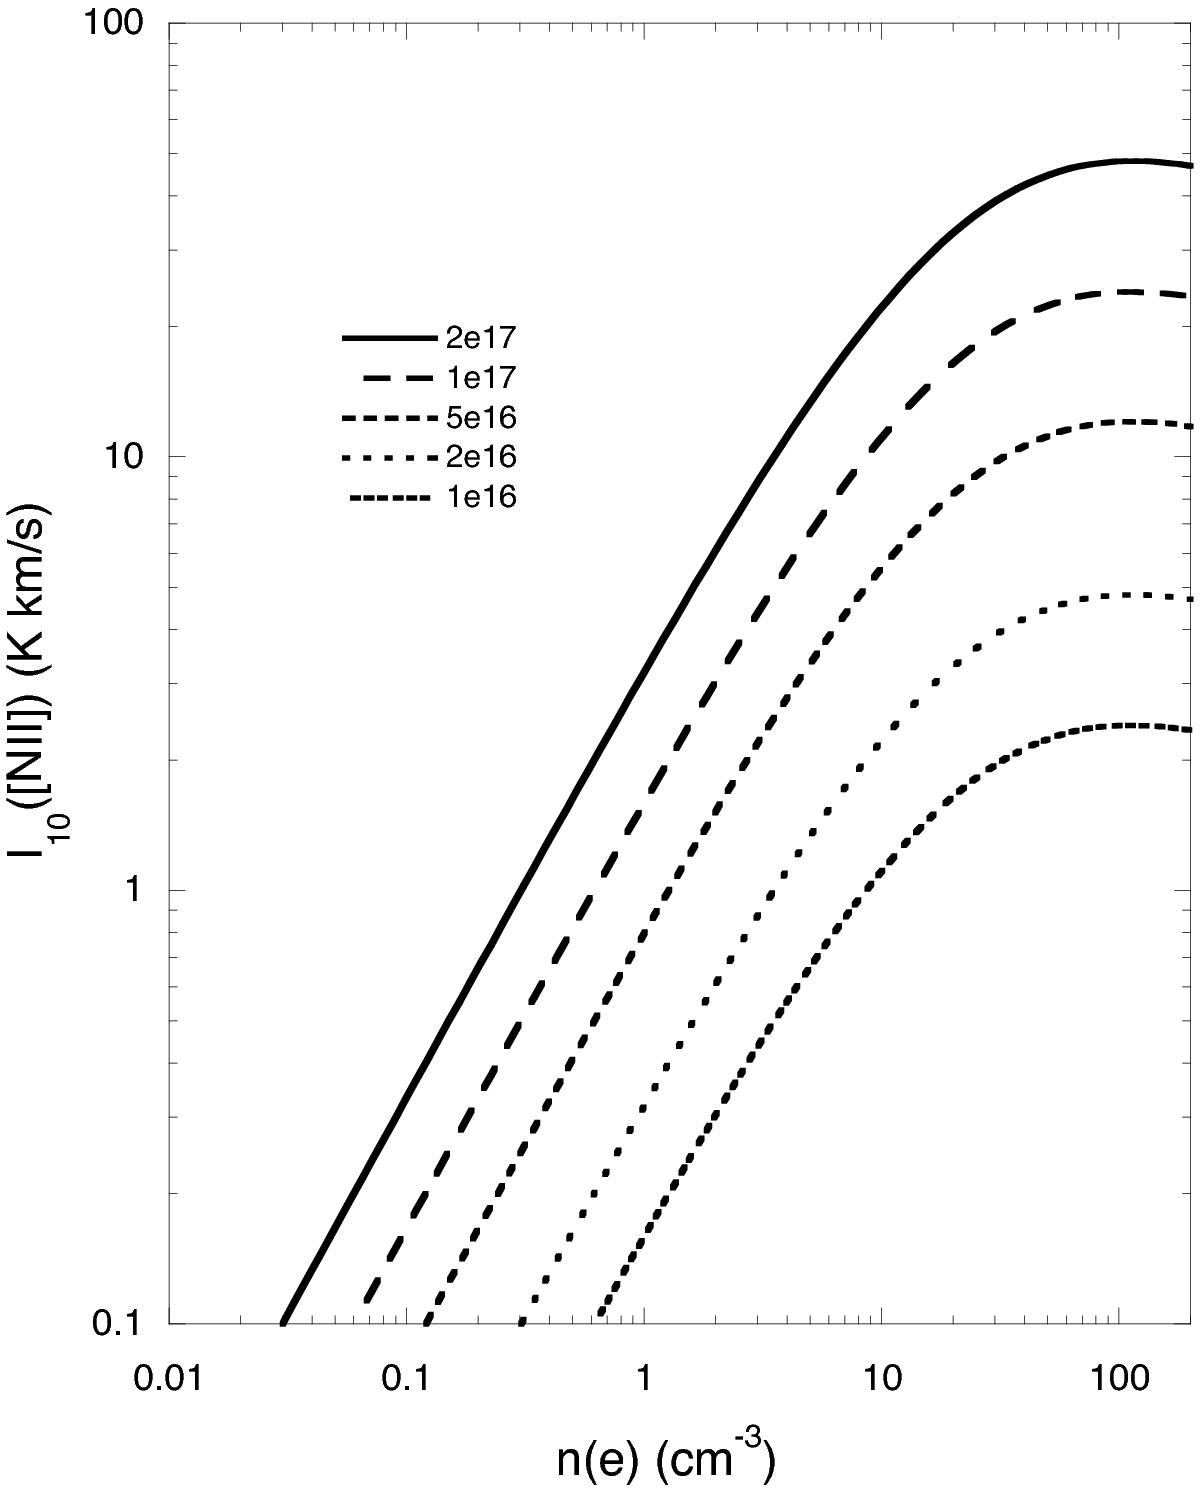
Intensity of [N ii] 205 μm line versus n(e) for a range of ionized nitrogen column densities; the insert gives the key for the column density. The curves flatten out as the density approaches the critical density.
Current usage metrics show cumulative count of Article Views (full-text article views including HTML views, PDF and ePub downloads, according to the available data) and Abstracts Views on Vision4Press platform.
Data correspond to usage on the plateform after 2015. The current usage metrics is available 48-96 hours after online publication and is updated daily on week days.
Initial download of the metrics may take a while.