Fig. 7
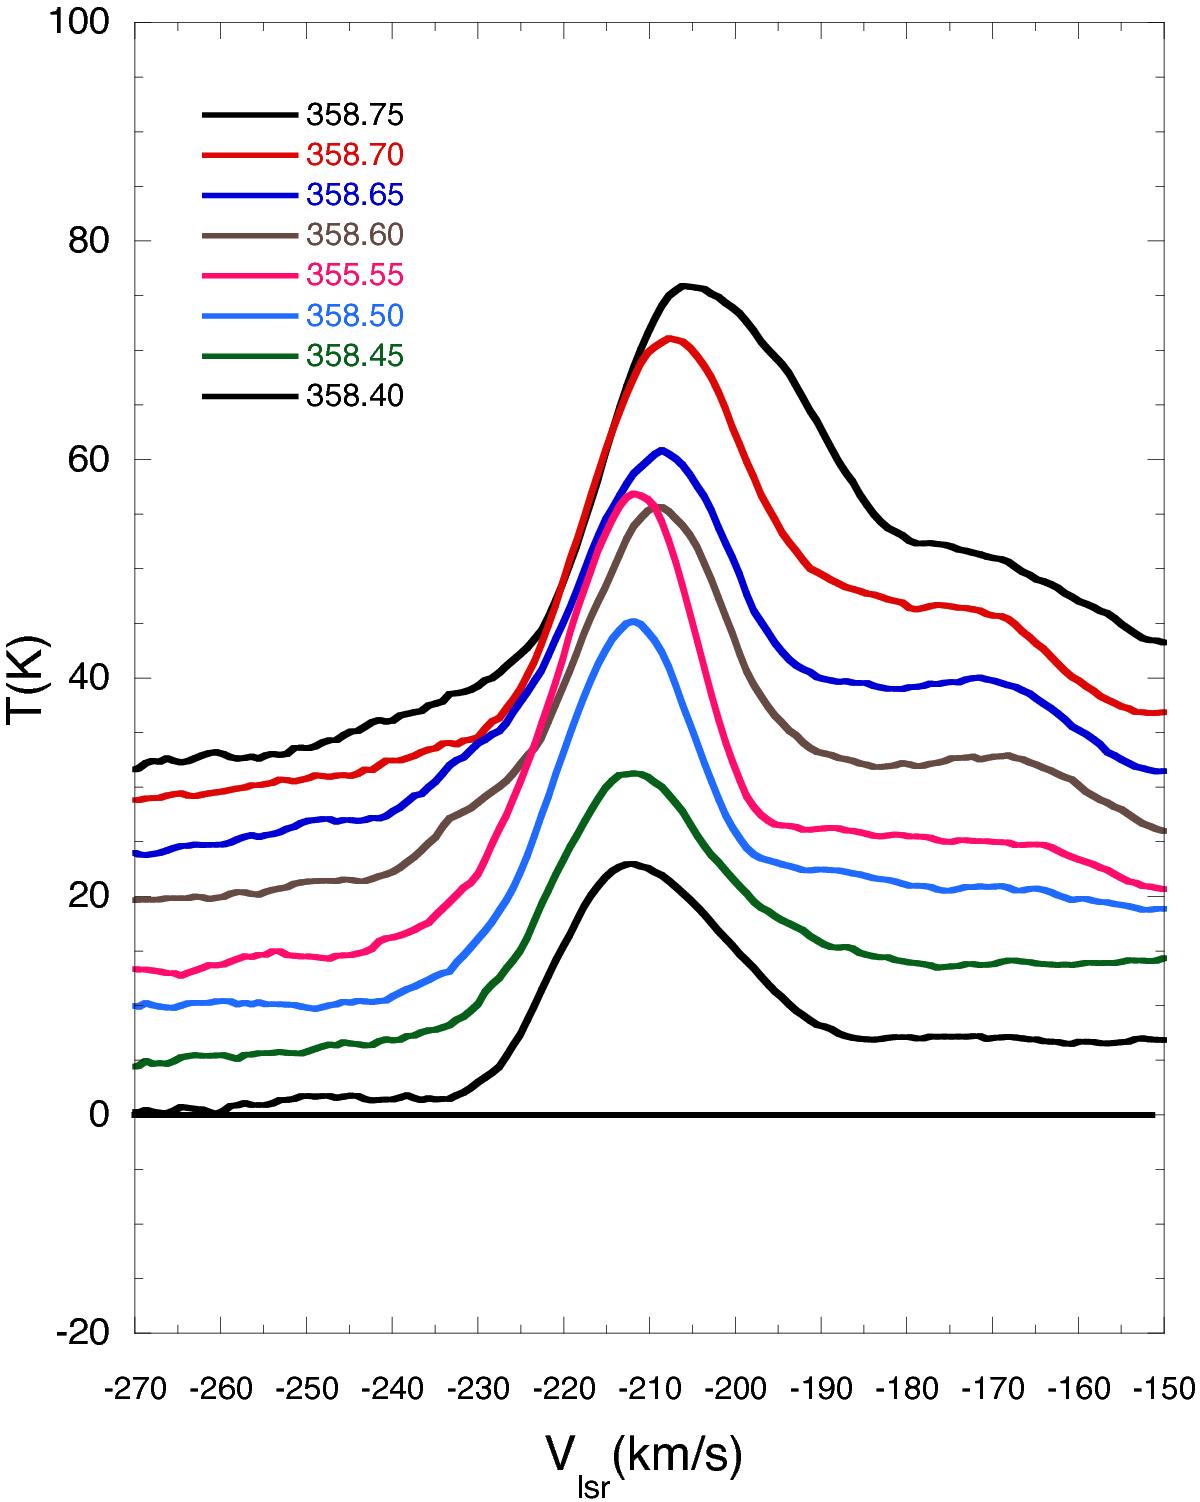
H i spectra at b = 0° along the latitudes observed in [C ii] and [N ii]. The data are taken from the ATCA H i survey (McClure-Griffiths et al. 2012) and the inset is a key to the lines of sight observed. H i is detected at all positions at −207 km s-1 and is strongest close to Sgr E. H i is also detected at −174 km s-1 but is weaker than at −207 km s-1.
Current usage metrics show cumulative count of Article Views (full-text article views including HTML views, PDF and ePub downloads, according to the available data) and Abstracts Views on Vision4Press platform.
Data correspond to usage on the plateform after 2015. The current usage metrics is available 48-96 hours after online publication and is updated daily on week days.
Initial download of the metrics may take a while.