Fig. 5
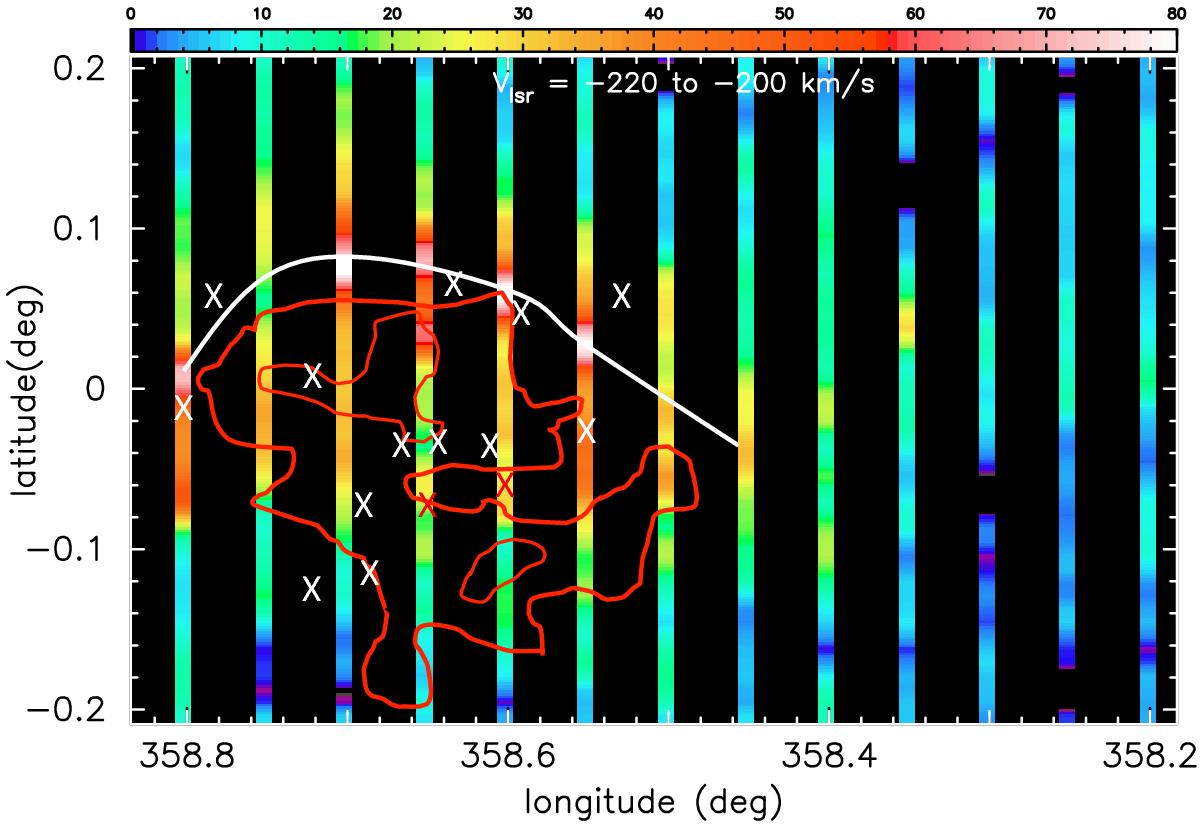
Comparison of the [C ii] OTF intensity maps integrated over the velocity range −220 km s-1 to −200 km s-1 shown as coulored strips with the CO map from Oka et al. (1998) integrated over the velocity range −220 to −210 km s-1. The CO integrated intensity maps from Oka et al. (1998) are shown only in 10 km s-1 steps, but to improve the S/N in the [C ii] OTF maps we use a range of 20 km s-1. The CO map integrated from −210 to −200 km s-1 shows the same extent in b and the same edge at l ~ 358.̊5 as the −220 to −210 km s-1 map, but extends further to 359.̊0, and would give the same morphological relationship to the [C ii] contours. The color bar at the top indicates the [C ii] integrated intensity in K km s-1. The [C ii] OTF maps sample in b every 0.̊05 in longitude from 358.̊2 to 358.̊8, so generating a contour map is impractical due to the sparse sampling in l. Instead we have indicated by the white line the connection of the peak intensity in each strip. The CO contours, indicated in red, are in steps of 15 K km s-1. The [C ii] is strongest slightly beyond the edge of the CO emission above the plane. The compact H ii sources towards Sgr E (Liszt 1992) are indicated by white and red X symbols, depending on background colour.
Current usage metrics show cumulative count of Article Views (full-text article views including HTML views, PDF and ePub downloads, according to the available data) and Abstracts Views on Vision4Press platform.
Data correspond to usage on the plateform after 2015. The current usage metrics is available 48-96 hours after online publication and is updated daily on week days.
Initial download of the metrics may take a while.