Fig. 2
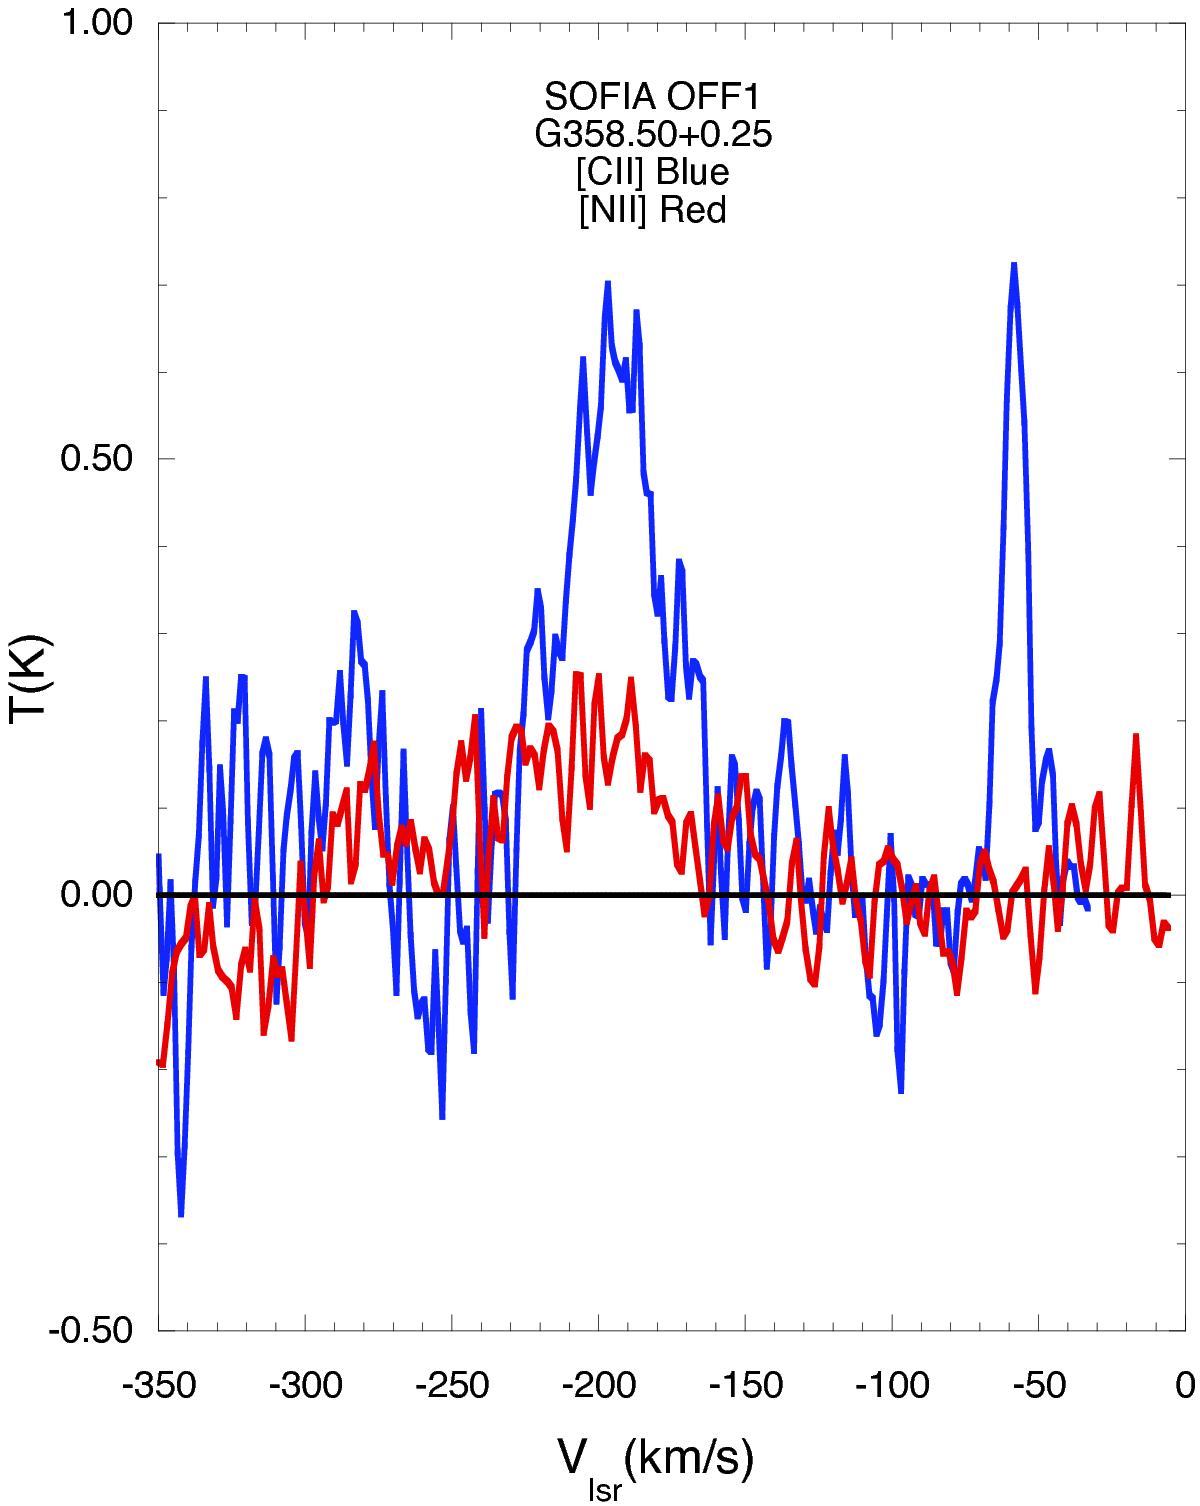
[C ii] and [N ii] emission in the reference OFF1 position at l = 358.̊50 and b = 0.̊25. The data have been smoothed to 2.4 km s-1 for [C ii] and 3.1 km s-1 for [N ii] to improve the S/N. The [C ii] emission peaks at Vlsr ~ −195 km s-1 while that from [N ii] peaks ~ −207 km s-1, within the fitting errors of the weaker [N ii] signal. The narrow [C ii] emission at Vlsr ~ −58 km s-1 arises from the 3 kpc arm. [N ii] is not detected from this arm.
Current usage metrics show cumulative count of Article Views (full-text article views including HTML views, PDF and ePub downloads, according to the available data) and Abstracts Views on Vision4Press platform.
Data correspond to usage on the plateform after 2015. The current usage metrics is available 48-96 hours after online publication and is updated daily on week days.
Initial download of the metrics may take a while.