Fig. 1
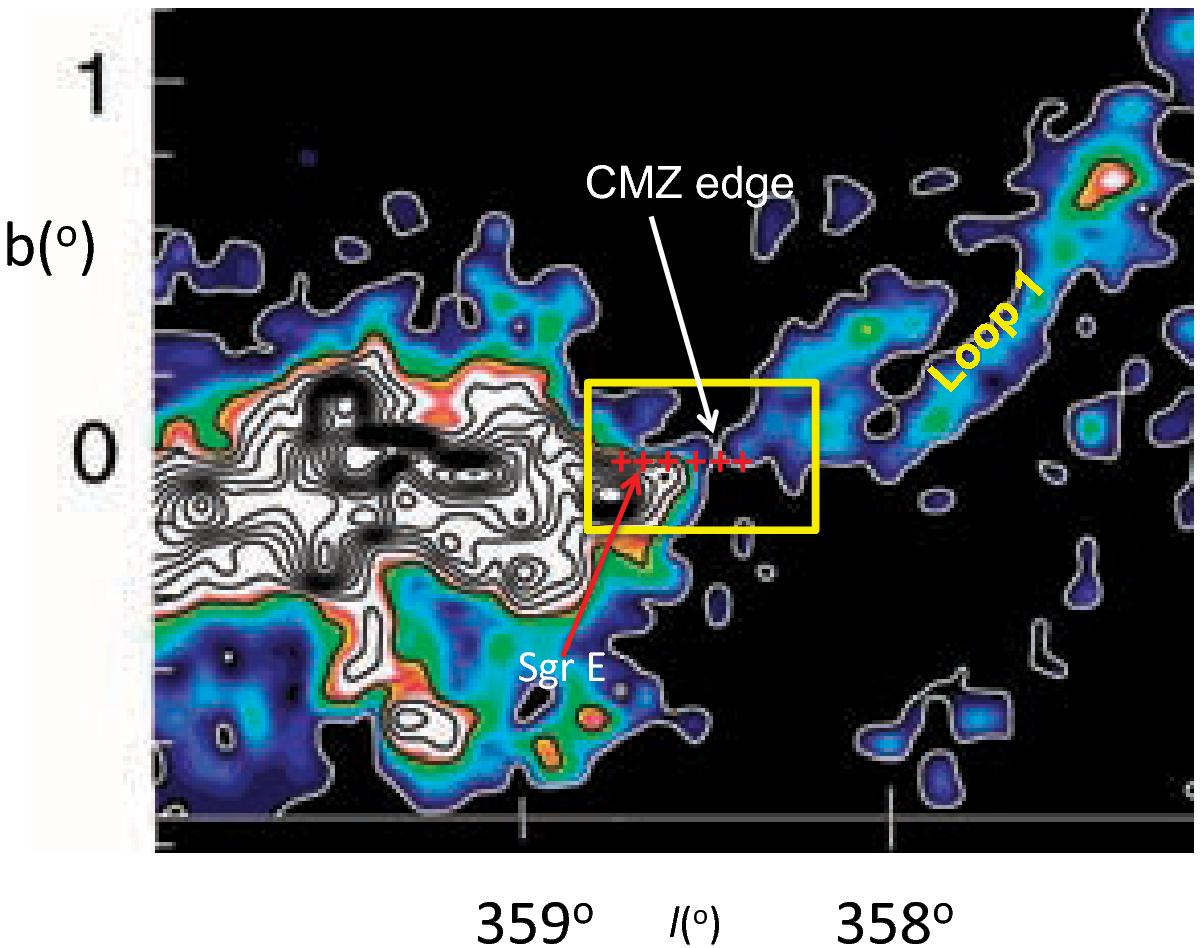
A portion of a map of CO integrated intensity from − 180 to − 90 km s-1 of the edge of the CMZ from Fukui et al. (2006), and reprinted with permission from AAAS, based on the NANTEN CO(1−0) map which has a beam size ~3′. The region mapped with HIFI is outlined by the yellow box and the positions of the [C ii] and [N ii] observations with GREAT are indicated by crosses. The approximate CO edge of the CMZ and a portion of Loop 1 are indicated, as is the location of Sgr E.
Current usage metrics show cumulative count of Article Views (full-text article views including HTML views, PDF and ePub downloads, according to the available data) and Abstracts Views on Vision4Press platform.
Data correspond to usage on the plateform after 2015. The current usage metrics is available 48-96 hours after online publication and is updated daily on week days.
Initial download of the metrics may take a while.