Fig. 2
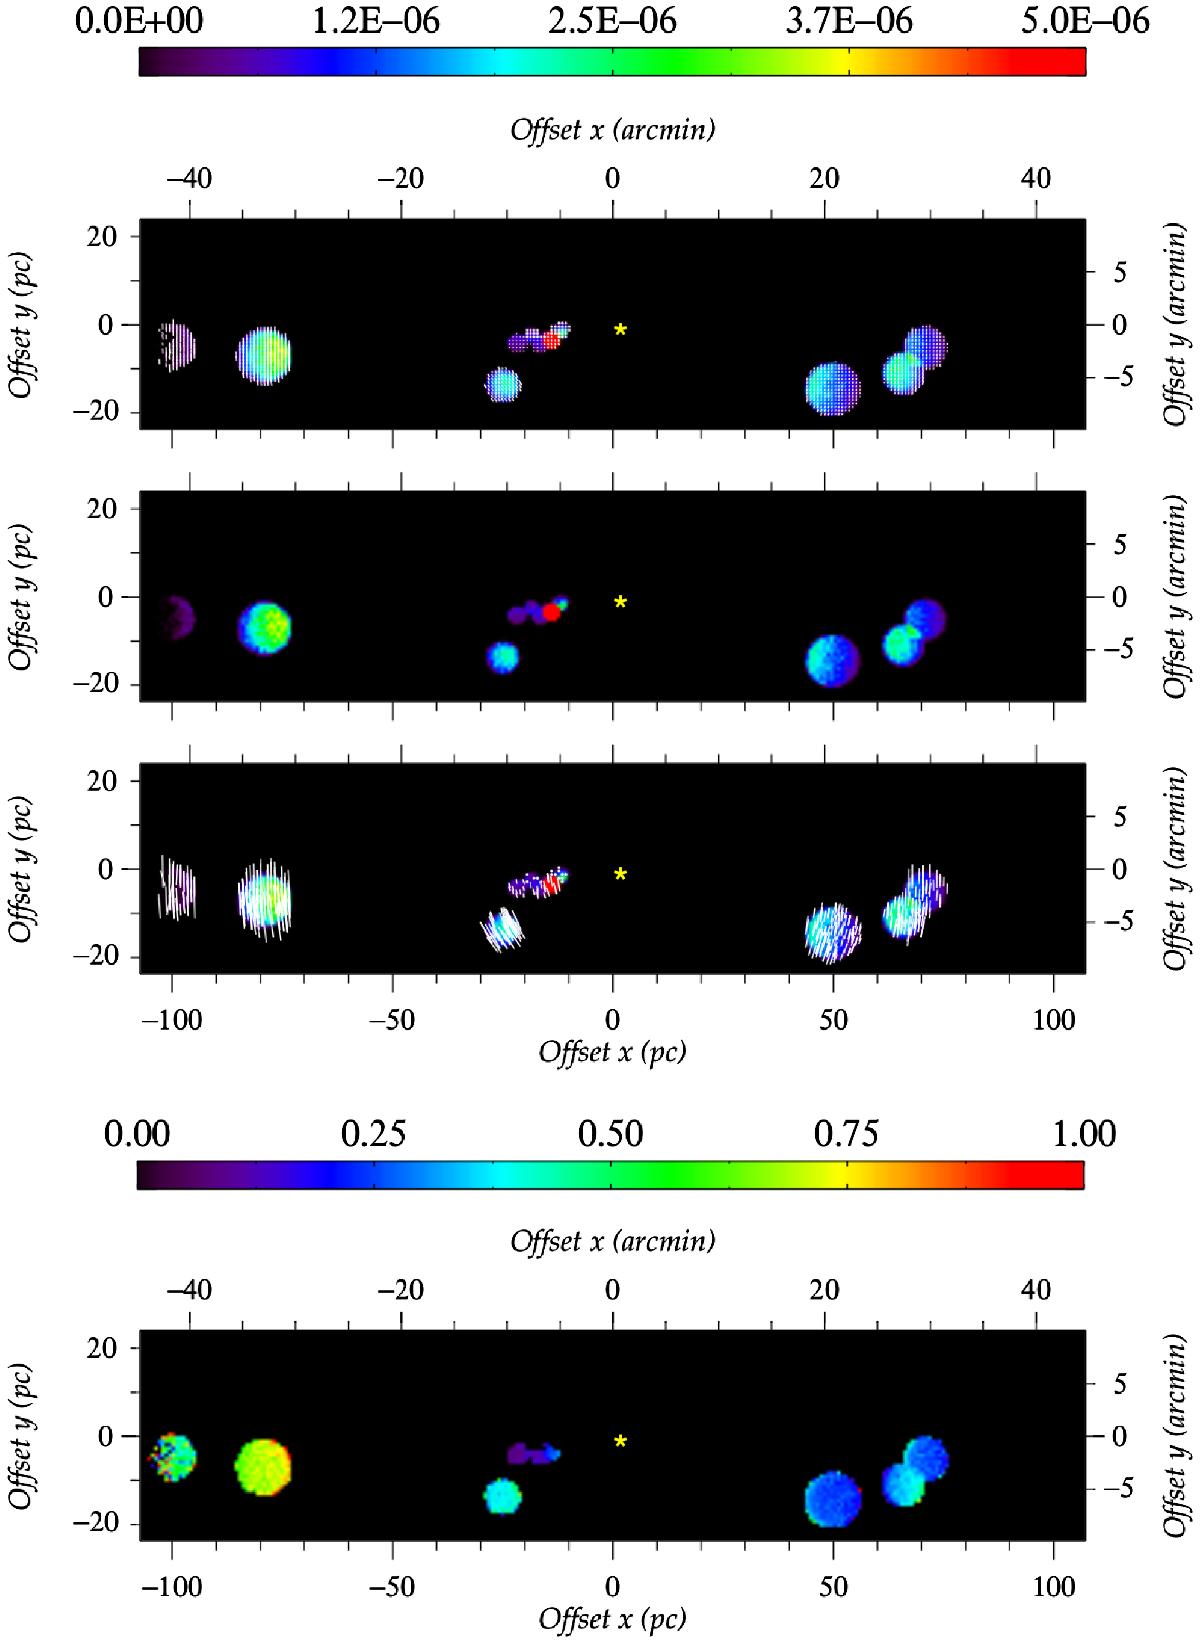
Simulated model images of the ~100 pc × 20 pc region around Sgr A∗. The top map shows the combination of polarized flux, PF/F∗ (color-coded, with the color scale shown on top of the image in arbitrary units), polarization position angle ψ (white bars drawn in the center of each spatial bin), and polarization degree P, whose value is proportional to the length of the bars. The second map is the polarized flux alone, the third image the polarization position angle ψ with artificially extended white vectors for better visibility, and the bottom map represents the P, color-coded, with the color scale shown at the top of the image in fractions of polarization. A yellow star indicates the position of Sgr A∗.
Current usage metrics show cumulative count of Article Views (full-text article views including HTML views, PDF and ePub downloads, according to the available data) and Abstracts Views on Vision4Press platform.
Data correspond to usage on the plateform after 2015. The current usage metrics is available 48-96 hours after online publication and is updated daily on week days.
Initial download of the metrics may take a while.