Fig. 7
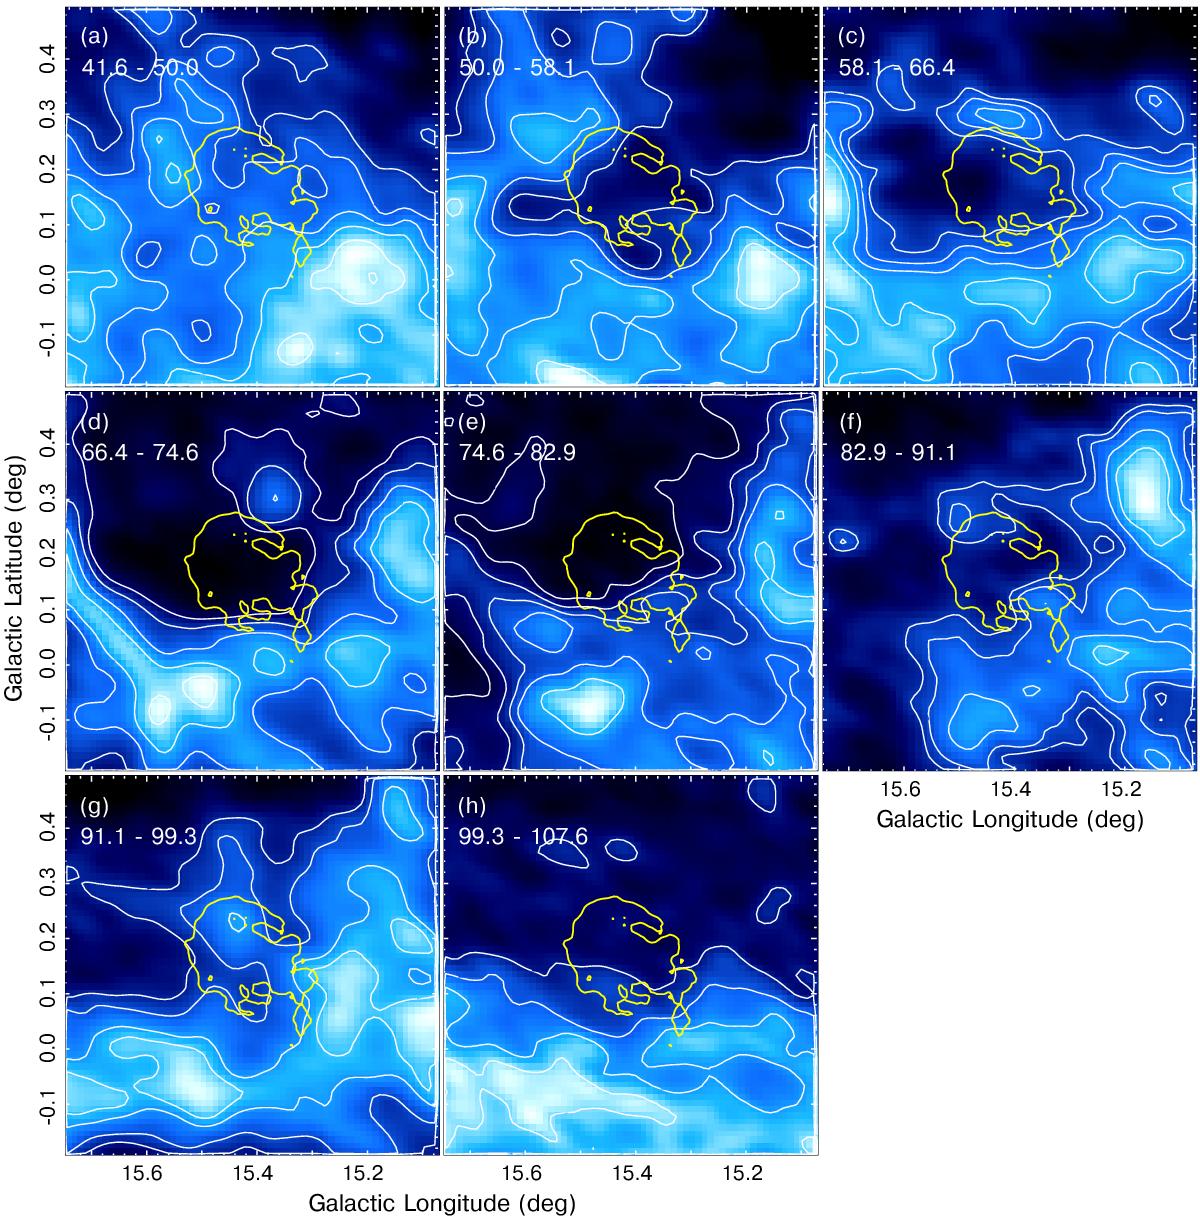
Images of 21 cm line emission in the direction of SNR G15.4+0.1. Each map corresponds to the integration of the neutral gas every 8.2 km s-1. The range of velocities is indicated at the top right corner of the panels. The colour display was kept for all images between 633 and 1210 K km s-1. The 0.7 mJy beam-1 contour from the 35′′ resolution 624 MHz image is included in each panel to facilitate the comparison between the radio continuum emission from the remnant and its surroundings.
Current usage metrics show cumulative count of Article Views (full-text article views including HTML views, PDF and ePub downloads, according to the available data) and Abstracts Views on Vision4Press platform.
Data correspond to usage on the plateform after 2015. The current usage metrics is available 48-96 hours after online publication and is updated daily on week days.
Initial download of the metrics may take a while.