Fig. 4
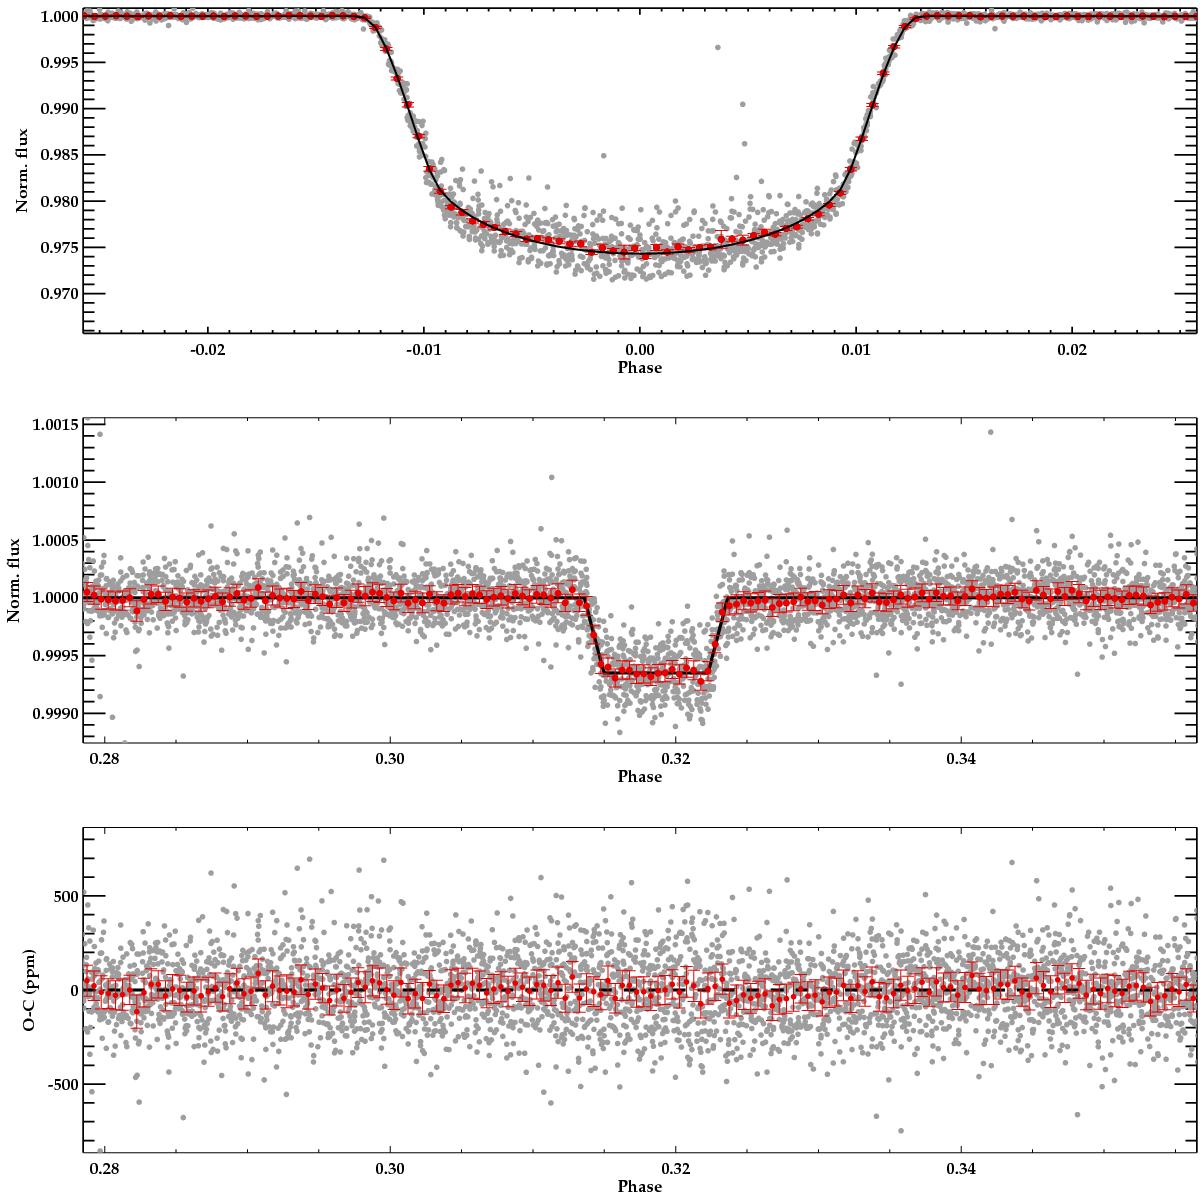
Detrended Kepler light curve of KOI-0340. In all panels small gray circles represent the Kepler data and the red filled circles is a binning of the whole data with a bin size of 0.005 in phase. Upper panel shows a zoom to the primary transit and the fitted primary eclipse with a solid black line (see Sect. 4). Middle panel shows the detected secondary eclipse and the fit obtained in Sect. 4 as a solid black line. Lower panel shows the residuals of the fit, with a standard deviation of 173 ppm in the original dataset and 36 ppm in the binned light curve.
Current usage metrics show cumulative count of Article Views (full-text article views including HTML views, PDF and ePub downloads, according to the available data) and Abstracts Views on Vision4Press platform.
Data correspond to usage on the plateform after 2015. The current usage metrics is available 48-96 hours after online publication and is updated daily on week days.
Initial download of the metrics may take a while.