Fig. 2
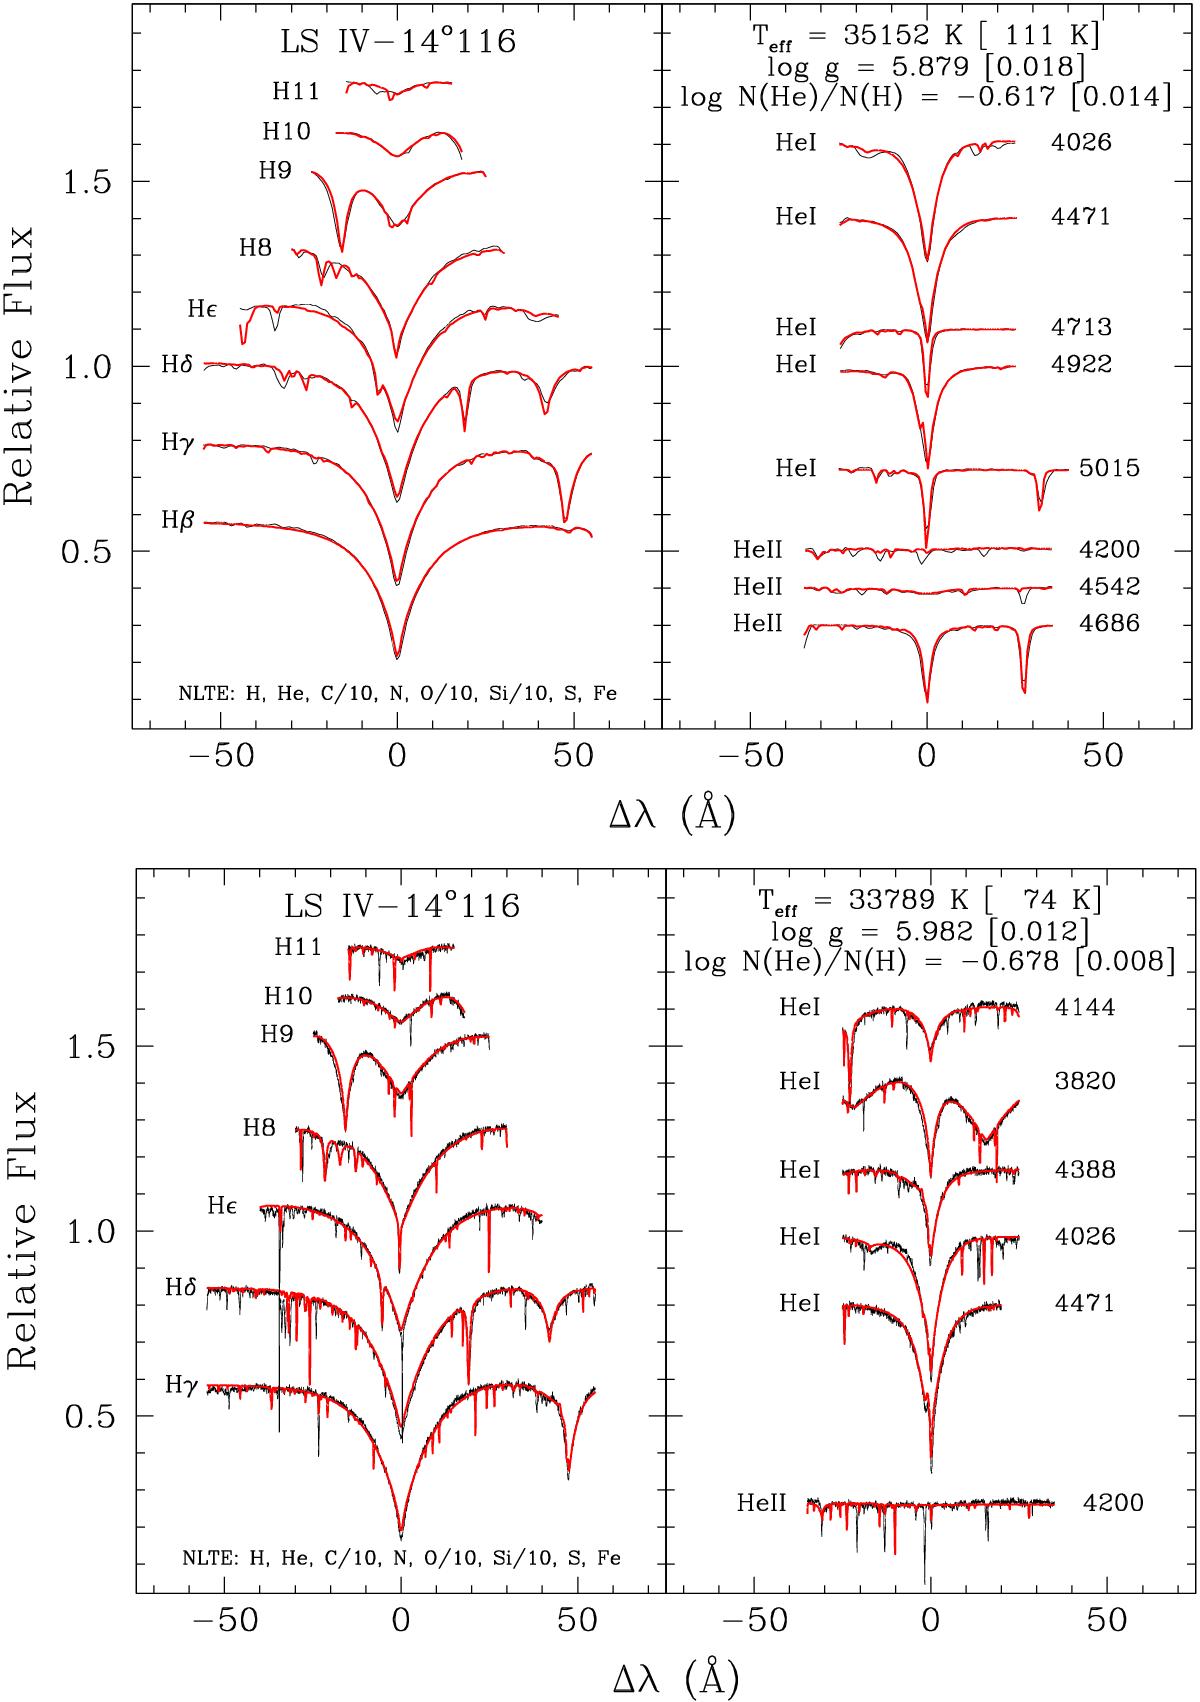
Top: fit to the Balmer and He lines in the FORS2 spectrum of LS IV-14°116. The thin black line is the observed spectrum, the thick red line represents the best-fit model atmosphere. The quoted uncertainties refer only to the formal fitting errors and certainly underestimate the true errors. Bottom: equivalent fit to the UVES spectrum.
Current usage metrics show cumulative count of Article Views (full-text article views including HTML views, PDF and ePub downloads, according to the available data) and Abstracts Views on Vision4Press platform.
Data correspond to usage on the plateform after 2015. The current usage metrics is available 48-96 hours after online publication and is updated daily on week days.
Initial download of the metrics may take a while.