Fig. 1
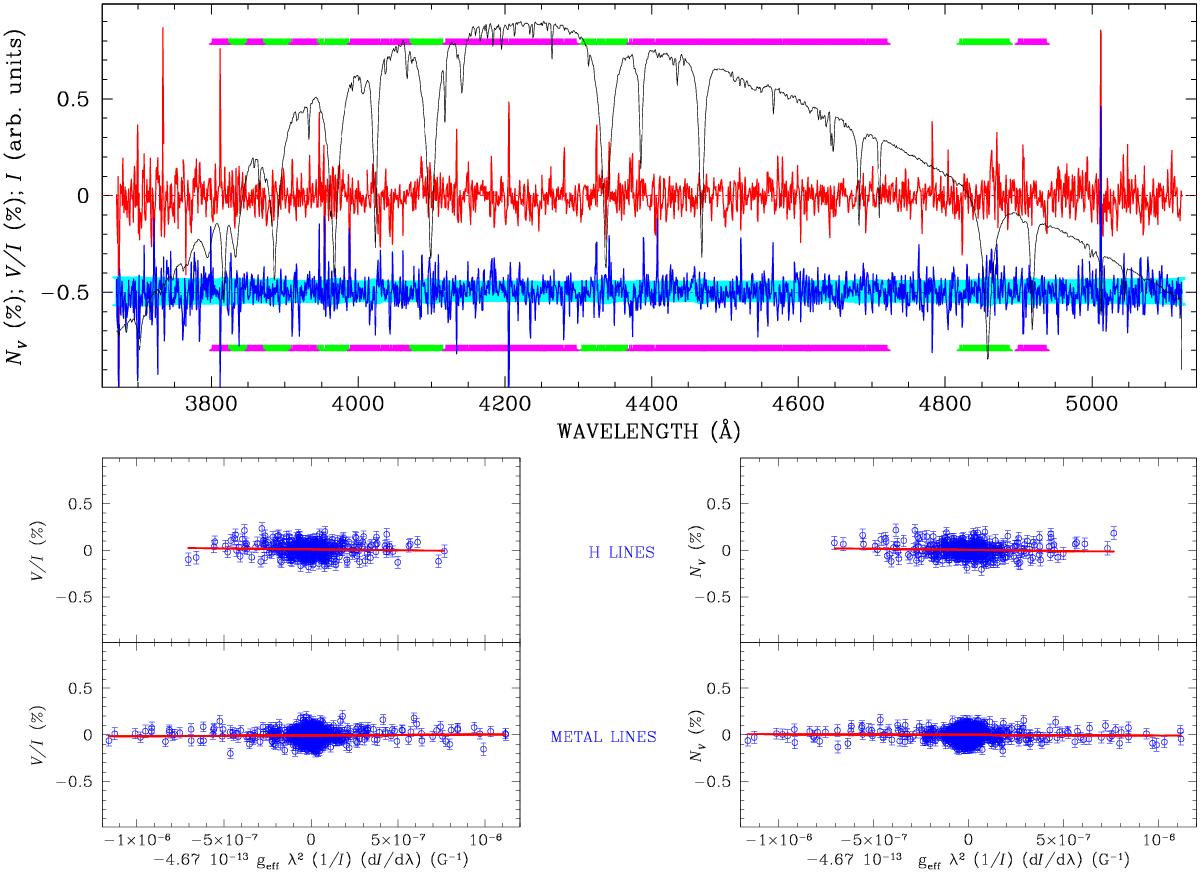
Top: total intensity FORS2 spectrum I (black) together with the normalised circular polarisation PV (red) and the null profile NV (blue) obtained by combining all data taken on 2014-06-05 for LS IV-14°116. The null profile is offset by −0.5% for display purposes, the 1σ errors expected from photon noise being represented by the light blue error bars. The green (magenta) marked wavelength ranges indicate the portions of the spectrum used for the analysis based on the H (metal) lines. Bottom: PV (left) and NV plotted as a function of the quantity indicated on the x-axis. The slope of PV in this diagram is proportional to the mean longitudinal magnetic field ⟨ Bz ⟩. The plots refer to the results obtained from using the H lines (green portions of the wavelength range in the top plot) and the metal lines (magenta portions) as indicated.
Current usage metrics show cumulative count of Article Views (full-text article views including HTML views, PDF and ePub downloads, according to the available data) and Abstracts Views on Vision4Press platform.
Data correspond to usage on the plateform after 2015. The current usage metrics is available 48-96 hours after online publication and is updated daily on week days.
Initial download of the metrics may take a while.