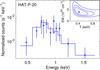
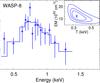
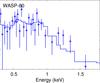
Fig. 4
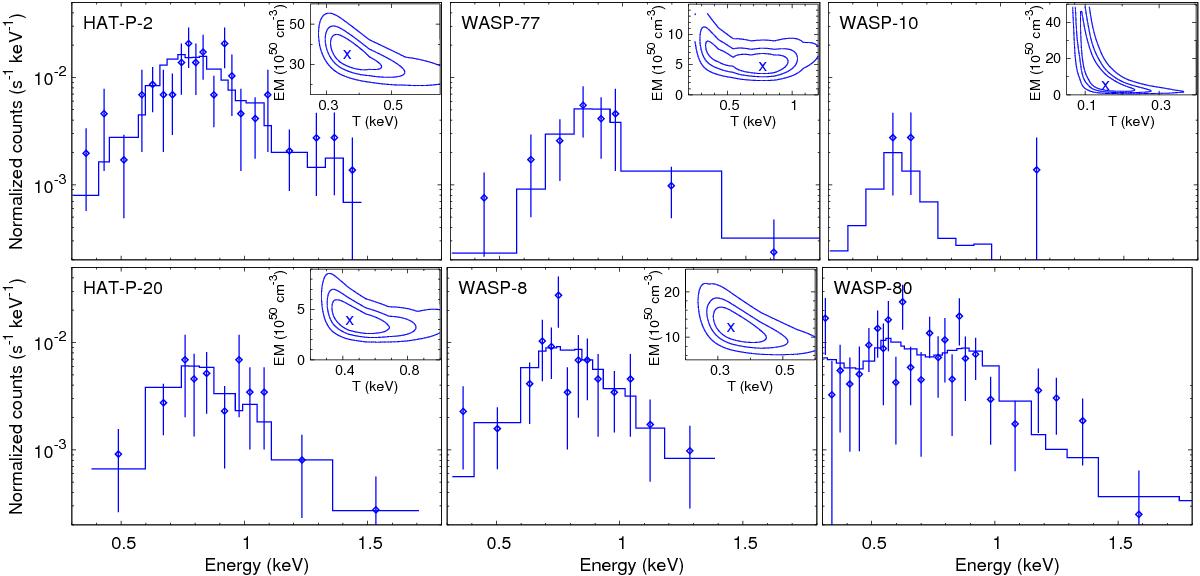
X-ray spectra of the targets. The plasma emission models are depicted by the histograms and the source count rates by diamonds with error bars. The χ2 contours for the 1, 2, and 3σ confidence intervals of the model parameters are shown in the inserts. WASP-80 was fitted with a two temperature model; the contours of the four parameters are not shown. With the exception of WASP-10, which only has five source counts, the model parameters are well confined.
Current usage metrics show cumulative count of Article Views (full-text article views including HTML views, PDF and ePub downloads, according to the available data) and Abstracts Views on Vision4Press platform.
Data correspond to usage on the plateform after 2015. The current usage metrics is available 48-96 hours after online publication and is updated daily on week days.
Initial download of the metrics may take a while.