Fig. 3
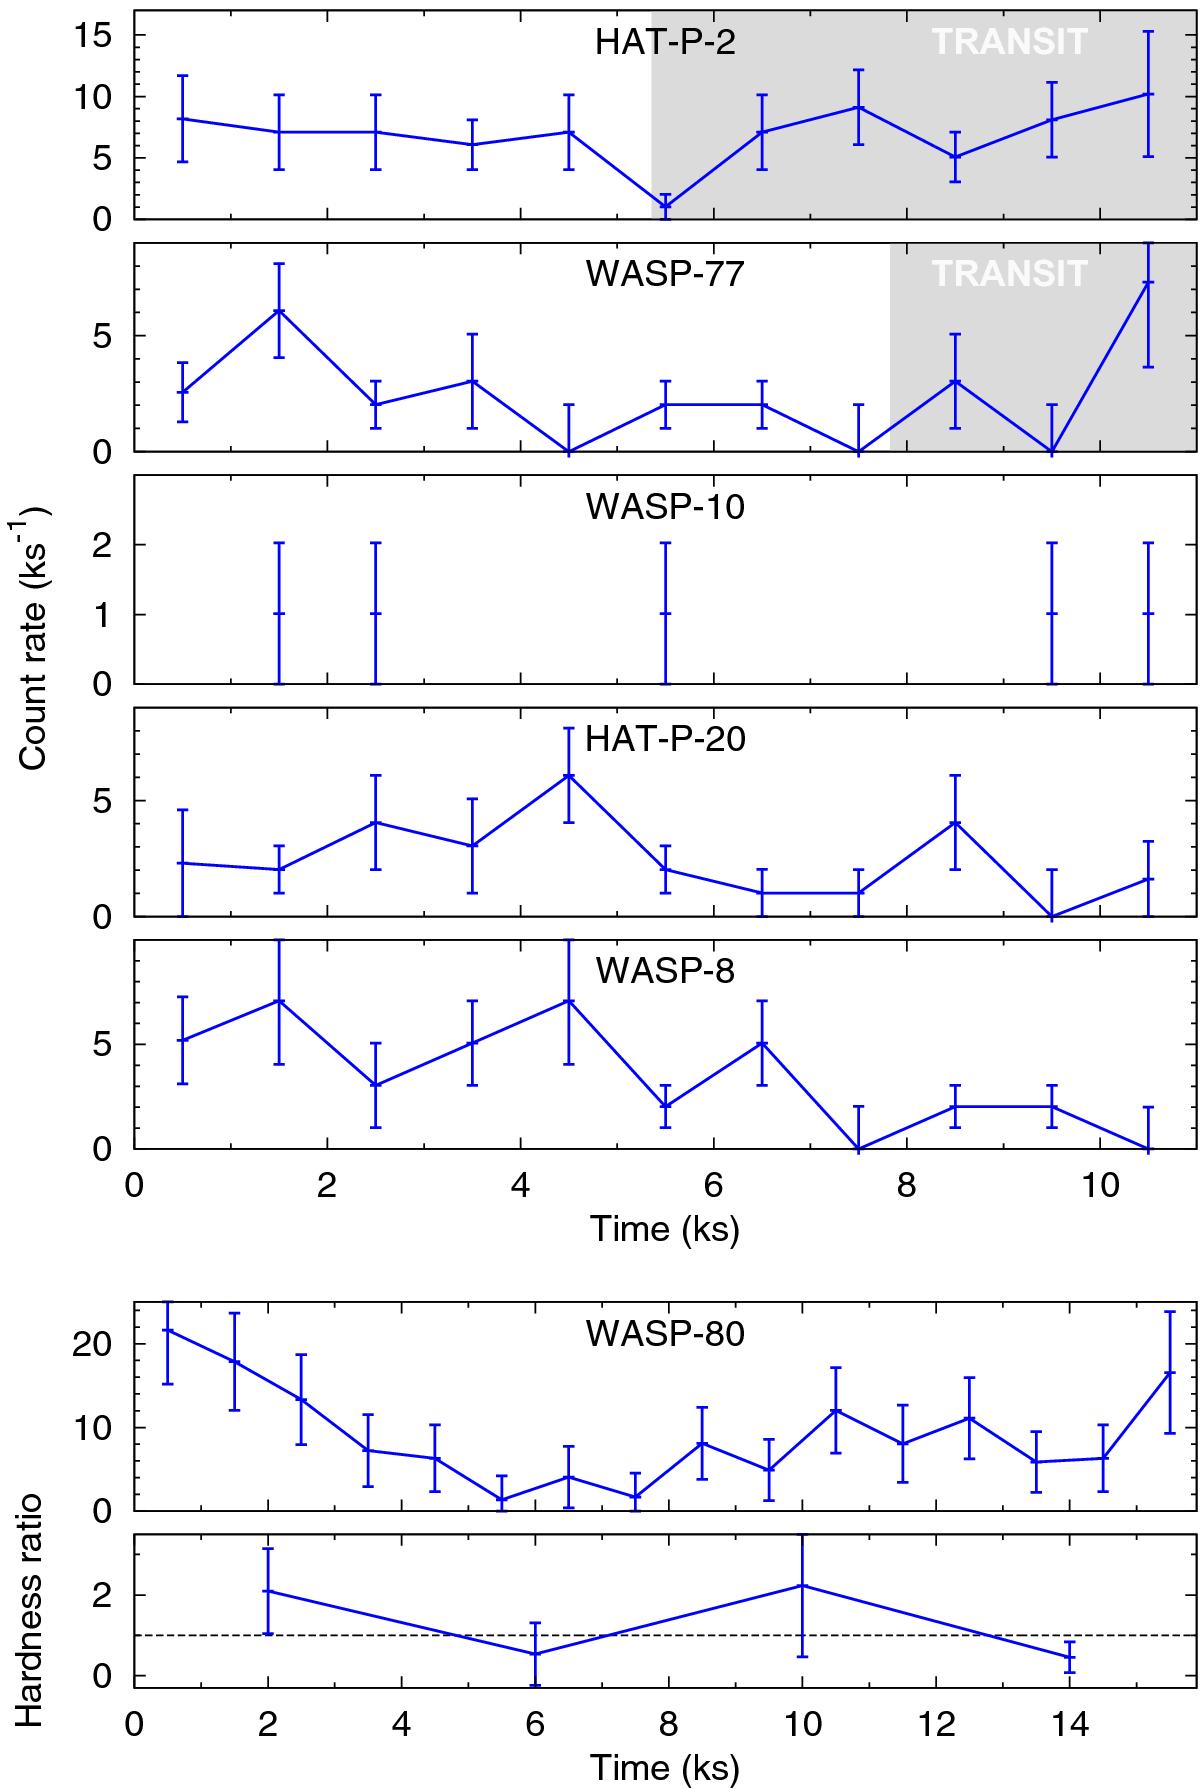
X-ray light curves of the targets with a 1 ks binning. The XMM-Newton observation of WASP-80 is about 5 ks longer, and the count rate is the sum of all EPIC detectors; the error is given by the pipeline. In the Chandra observations, error bars represent the 1-sigma Poissonian uncertainty on the count rate. Planetary transits during observations are marked by shaded areas. The WASP-10 panel shows only the arrival times of the five source photons. The last panel depicts the hardness ratio (0.65 − 2.0/0.2 − 0.65 keV) in the WASP-80 observation. No pronounced flare occurred during the observations.
Current usage metrics show cumulative count of Article Views (full-text article views including HTML views, PDF and ePub downloads, according to the available data) and Abstracts Views on Vision4Press platform.
Data correspond to usage on the plateform after 2015. The current usage metrics is available 48-96 hours after online publication and is updated daily on week days.
Initial download of the metrics may take a while.