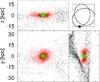
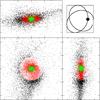
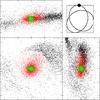
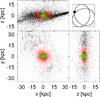
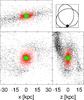
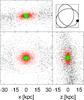
Fig. 3
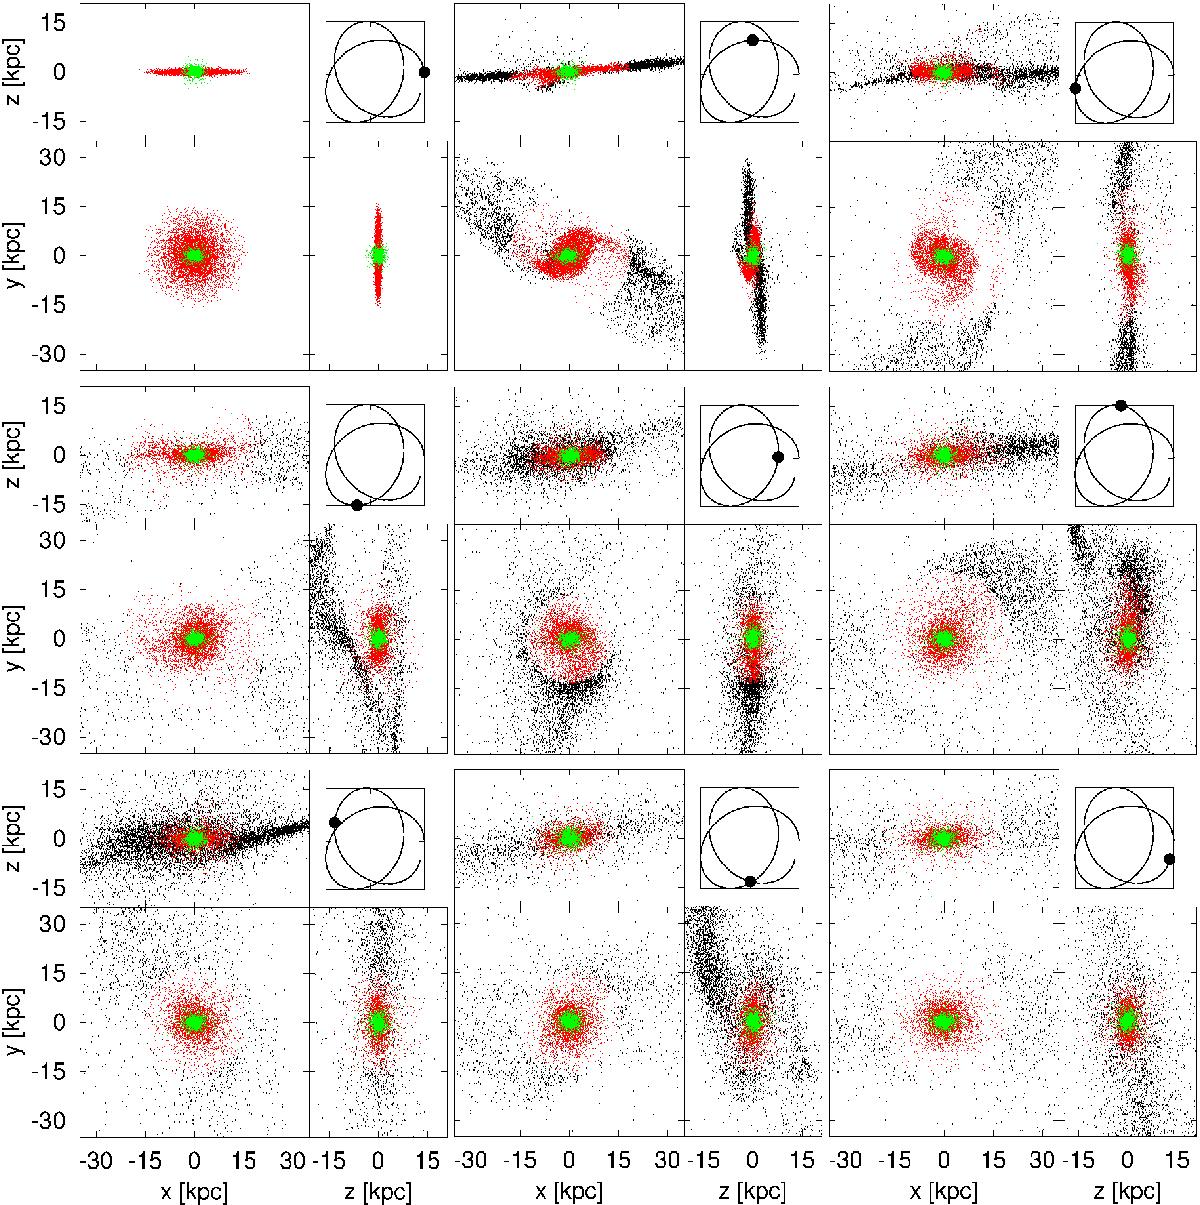
Snapshots from the first simulation run of the setup with the closest orbit, i.e. an apocentre of 0.5 Mpc and pericentre of 0.3 Mpc. The timestep between snapshots is 625 Myr; they start at the upper left at 0 Gyr and reach the lower right after 5 Gyr. Each snapshot image shows the galaxy face-on and from two perpendicular edge-on viewpoints. In the upper right corner of each image, the actual position on the orbit around the cluster centre is marked. The red dots are bound disk particles, the green dots are bound bulge particles, and the black dots are unbound stellar particles.
Current usage metrics show cumulative count of Article Views (full-text article views including HTML views, PDF and ePub downloads, according to the available data) and Abstracts Views on Vision4Press platform.
Data correspond to usage on the plateform after 2015. The current usage metrics is available 48-96 hours after online publication and is updated daily on week days.
Initial download of the metrics may take a while.