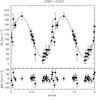
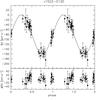
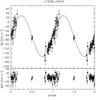
Fig. 1
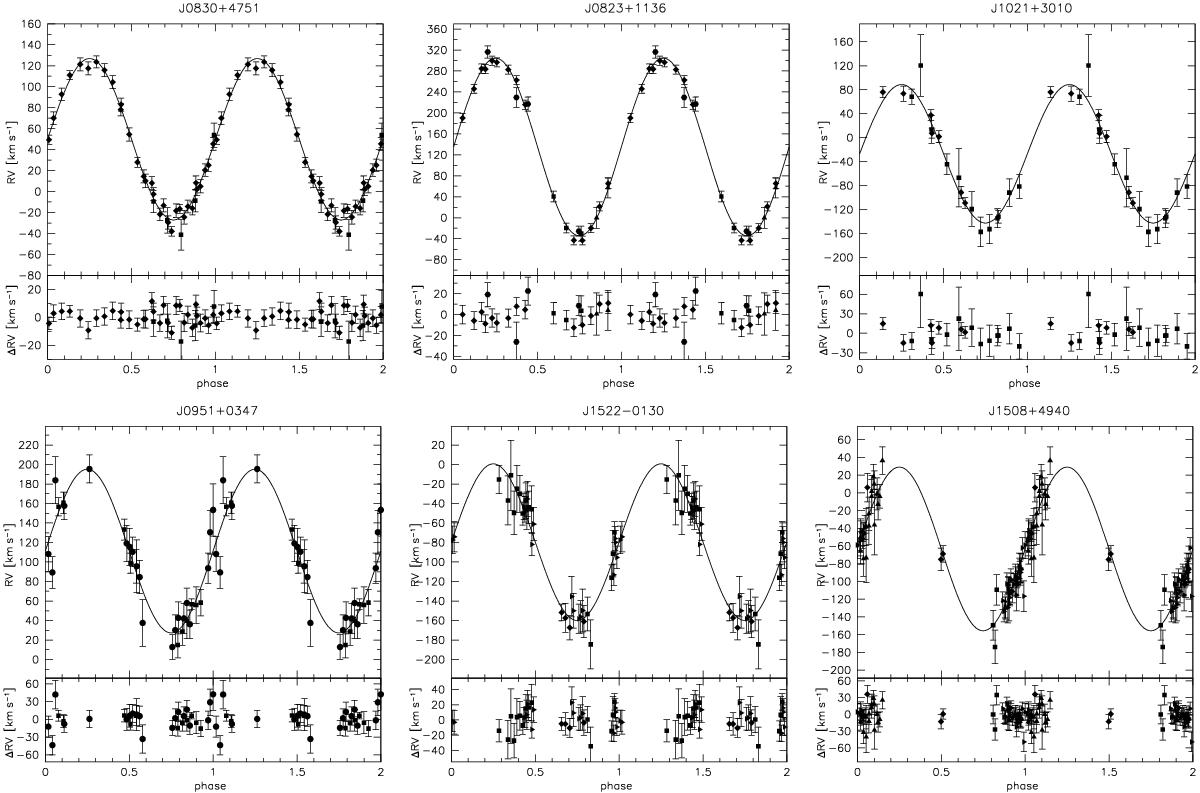
Radial velocity plotted against orbital phase. The RV data were phase folded with the most likely orbital periods and are plotted twice for better visualisation. The residuals are plotted below. The RVs were measured from spectra obtained with SDSS (squares), CAHA3.5m/TWIN (upward triangles), WHT/ISIS (diamonds), Gemini/GMOS (triangles turned to the right), ESO-NTT/EFOSC2 (circles), and SOAR/Goodman (pentagons).
Current usage metrics show cumulative count of Article Views (full-text article views including HTML views, PDF and ePub downloads, according to the available data) and Abstracts Views on Vision4Press platform.
Data correspond to usage on the plateform after 2015. The current usage metrics is available 48-96 hours after online publication and is updated daily on week days.
Initial download of the metrics may take a while.