Fig. 4
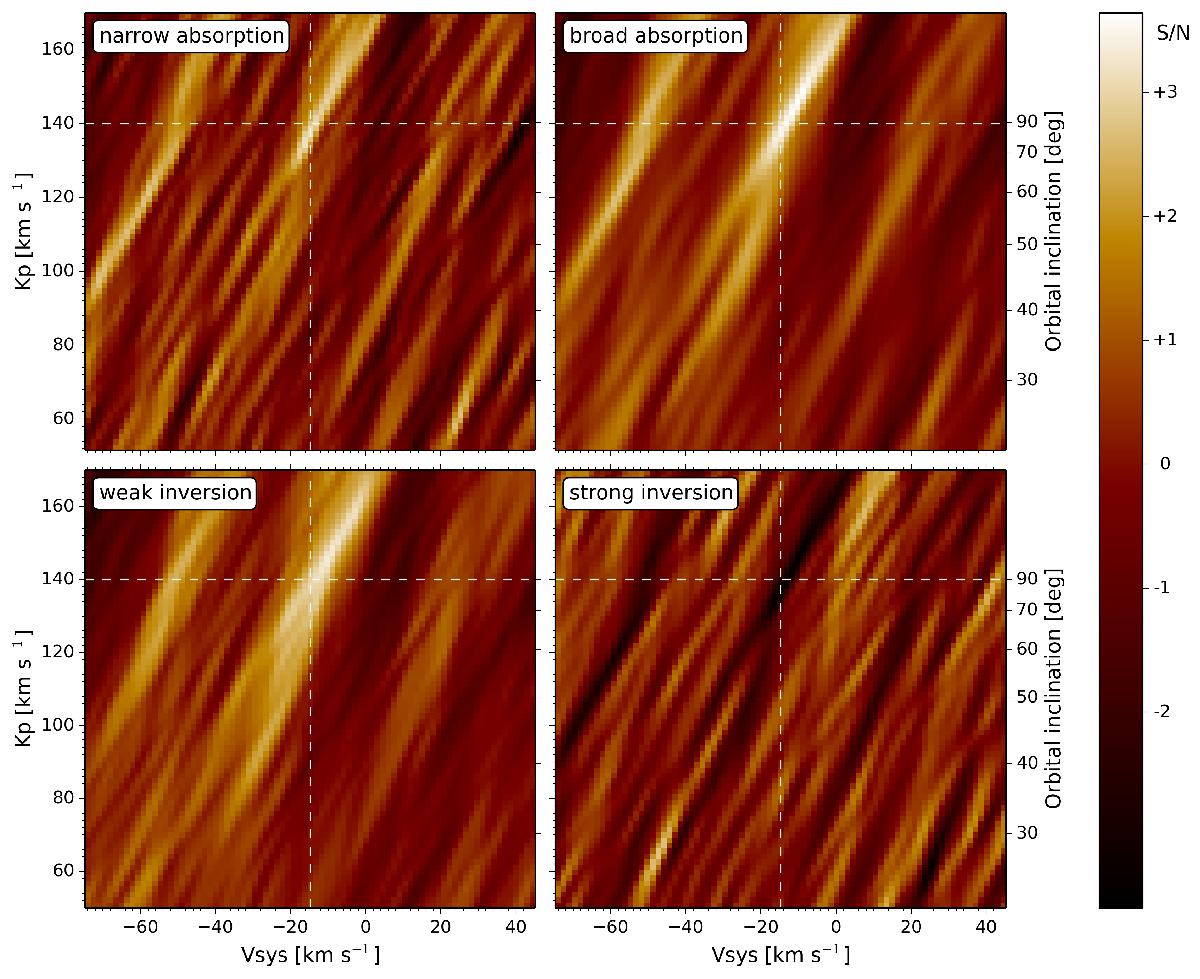
Total cross-correlation diagrams for the four models illustrated in Fig. 2 after summing over time for a range of Vsys and KP values, and combining detectors 2 and 3 from the three observation nights. The dashed white lines indicate the expected planet signal based on literature values, which coincides with a weak correlation signal in the case of the two absorption models as well as the weak-inversion model, and a weak anti-correlation signal in the case of the strong-inversion model. Although there are hints of a signal visible, CO is not detected with statistical significance.
Current usage metrics show cumulative count of Article Views (full-text article views including HTML views, PDF and ePub downloads, according to the available data) and Abstracts Views on Vision4Press platform.
Data correspond to usage on the plateform after 2015. The current usage metrics is available 48-96 hours after online publication and is updated daily on week days.
Initial download of the metrics may take a while.