Fig. 2
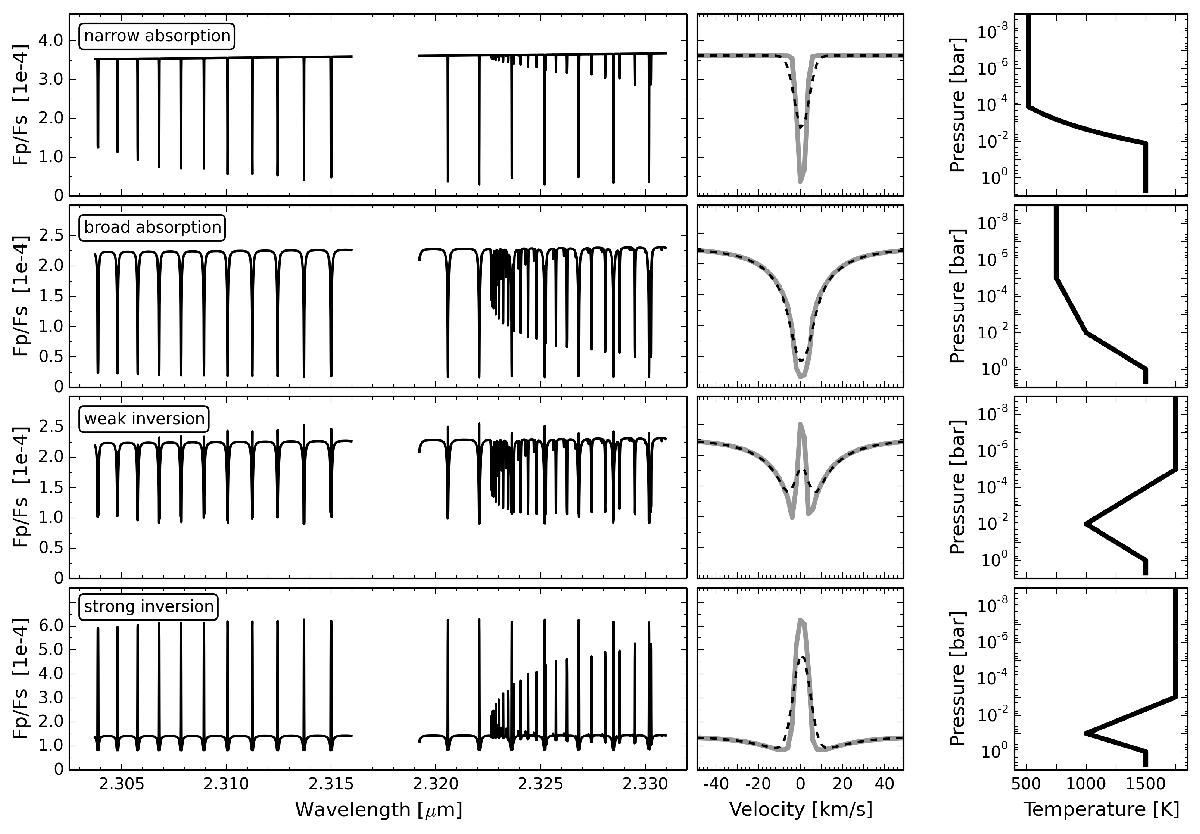
Examples of CO model spectra used in the cross-correlation analysis. The model in the top row has an adiabatic lapse rate and a CO VMR of 10-4.5, resulting in strong, narrow absorption lines. The following three rows are models from the T/P grid described in Sect. 4.1, all with CO VMR = 10-4.0: the first is without a thermal inversion and with relatively broad absorption lines, the second is with a weak inversion, and the last model is for a strong thermal inversion. The left column displays the models before convolution to CRIRES resolution over the wavelength coverage of the two central detectors. The middle column zooms in on the CO line at approximately 2.3205 μm, showing the line profiles both before (solid) and after (dashed) convolution to CRIRES resolution. The right column gives the corresponding T/P profiles.
Current usage metrics show cumulative count of Article Views (full-text article views including HTML views, PDF and ePub downloads, according to the available data) and Abstracts Views on Vision4Press platform.
Data correspond to usage on the plateform after 2015. The current usage metrics is available 48-96 hours after online publication and is updated daily on week days.
Initial download of the metrics may take a while.