Fig. 1
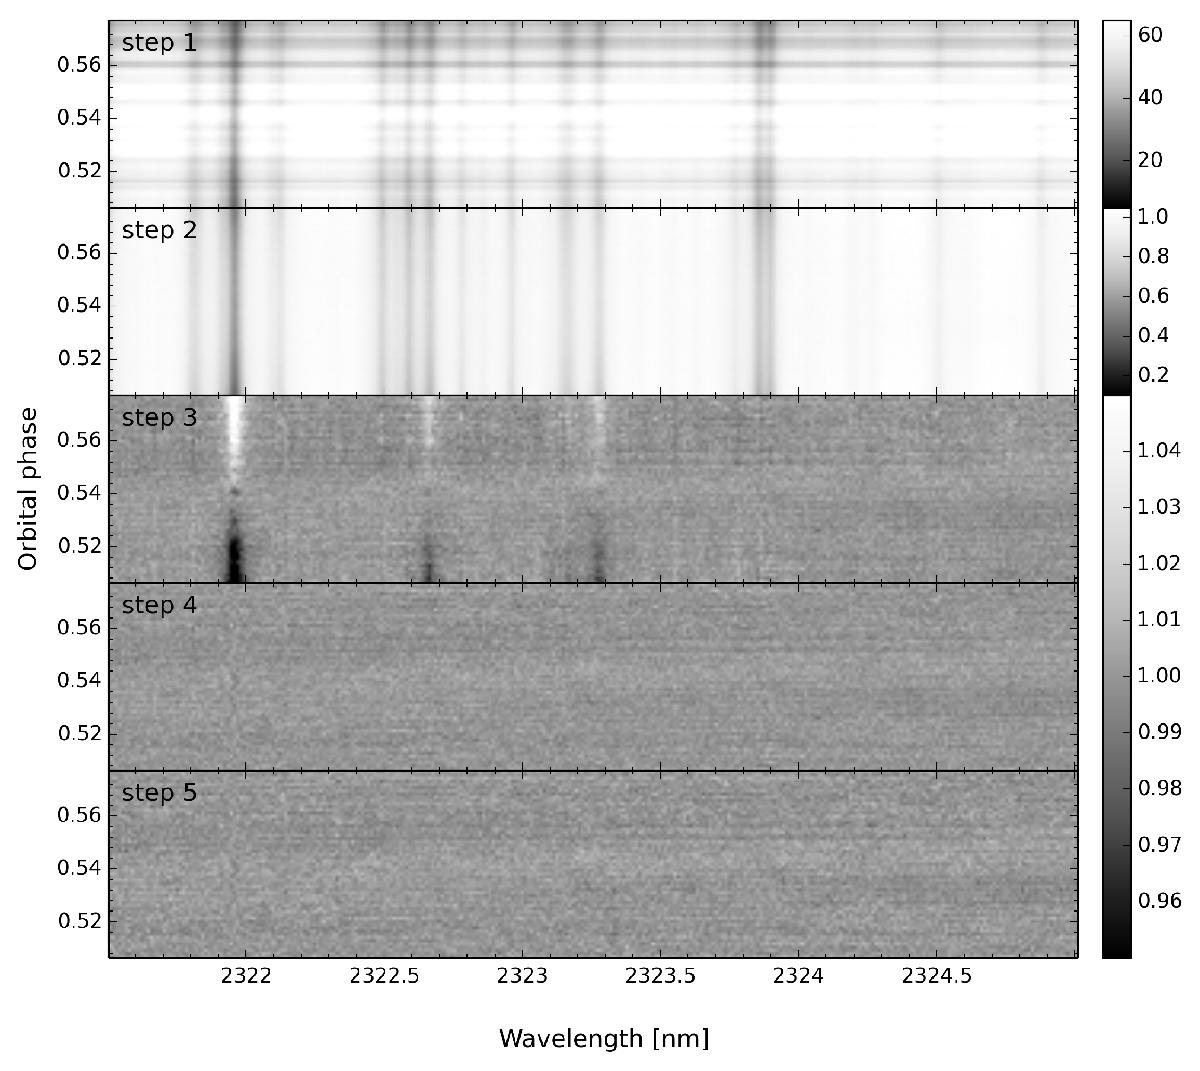
Overview of the different steps in the data analysis, showing a small fraction of the third array from the first night of observations. From top to bottom, step 1 shows the extracted spectra after bad-pixel correction, step 2 after spectral alignment and normalization, step 3 after first-order airmass correction, step 4 after second-order airmass correction, and step 5 after normalization of each column with the variance.
Current usage metrics show cumulative count of Article Views (full-text article views including HTML views, PDF and ePub downloads, according to the available data) and Abstracts Views on Vision4Press platform.
Data correspond to usage on the plateform after 2015. The current usage metrics is available 48-96 hours after online publication and is updated daily on week days.
Initial download of the metrics may take a while.