Fig. 9
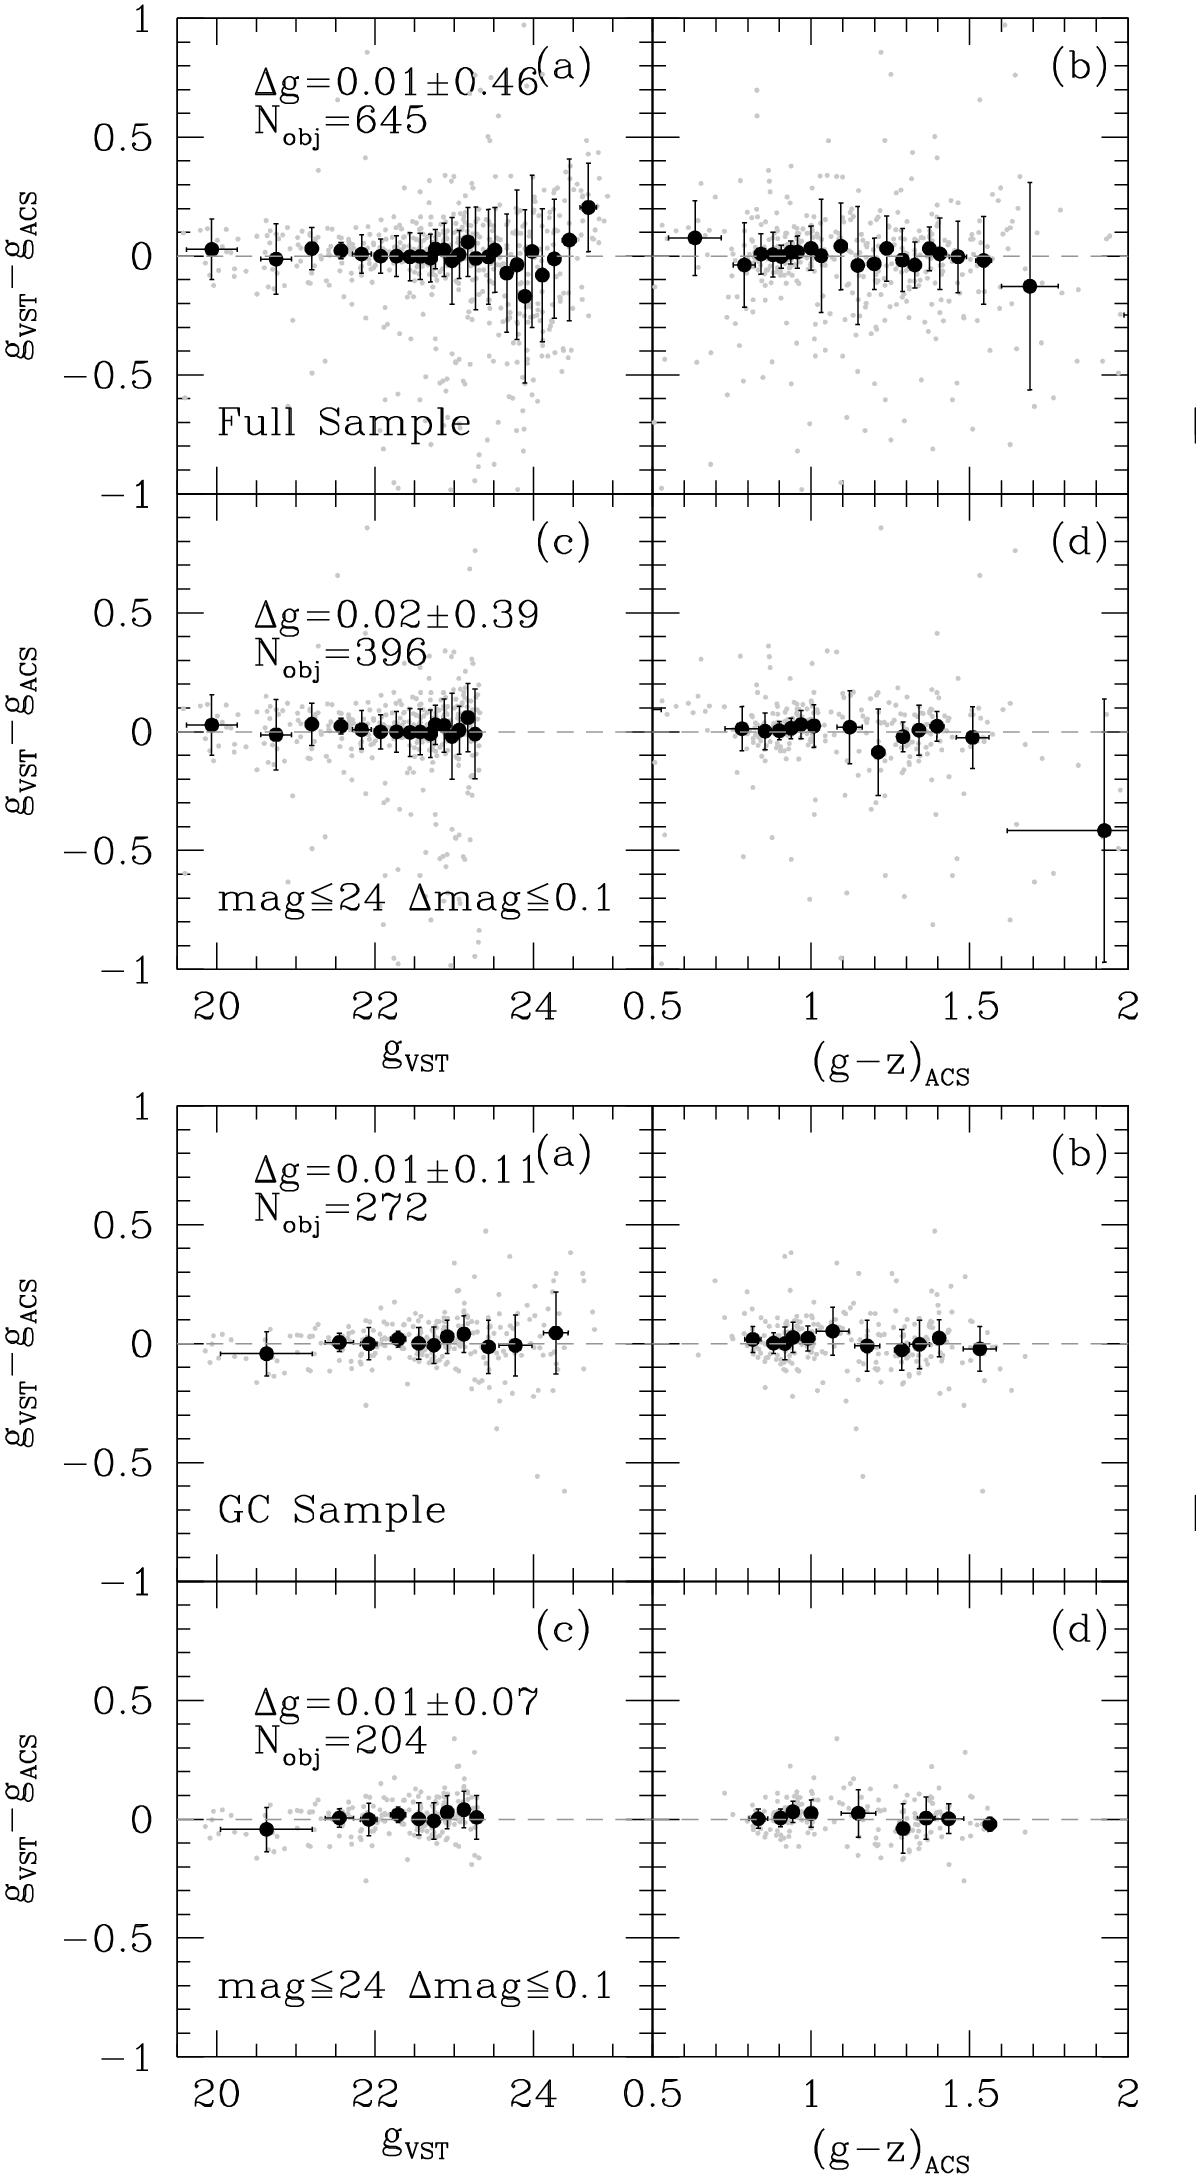
Magnitude comparison between VEGAS-SSS and ACS. Left panels: a) and b) comparison for the full list of ACS to VEGAS-SSS matching sources (gray dots). The running mean and the corresponding rms are shown with black circles and error bars. The median difference, the rms and the number of objects matched are also labeled. Panels c) and d) are the same as the upper panels, but for sources with magnitude and photometric error cuts as labeled. Right: as left panels, but only GC candidates in the ACS catalog are considered.
Current usage metrics show cumulative count of Article Views (full-text article views including HTML views, PDF and ePub downloads, according to the available data) and Abstracts Views on Vision4Press platform.
Data correspond to usage on the plateform after 2015. The current usage metrics is available 48-96 hours after online publication and is updated daily on week days.
Initial download of the metrics may take a while.