Fig. 8
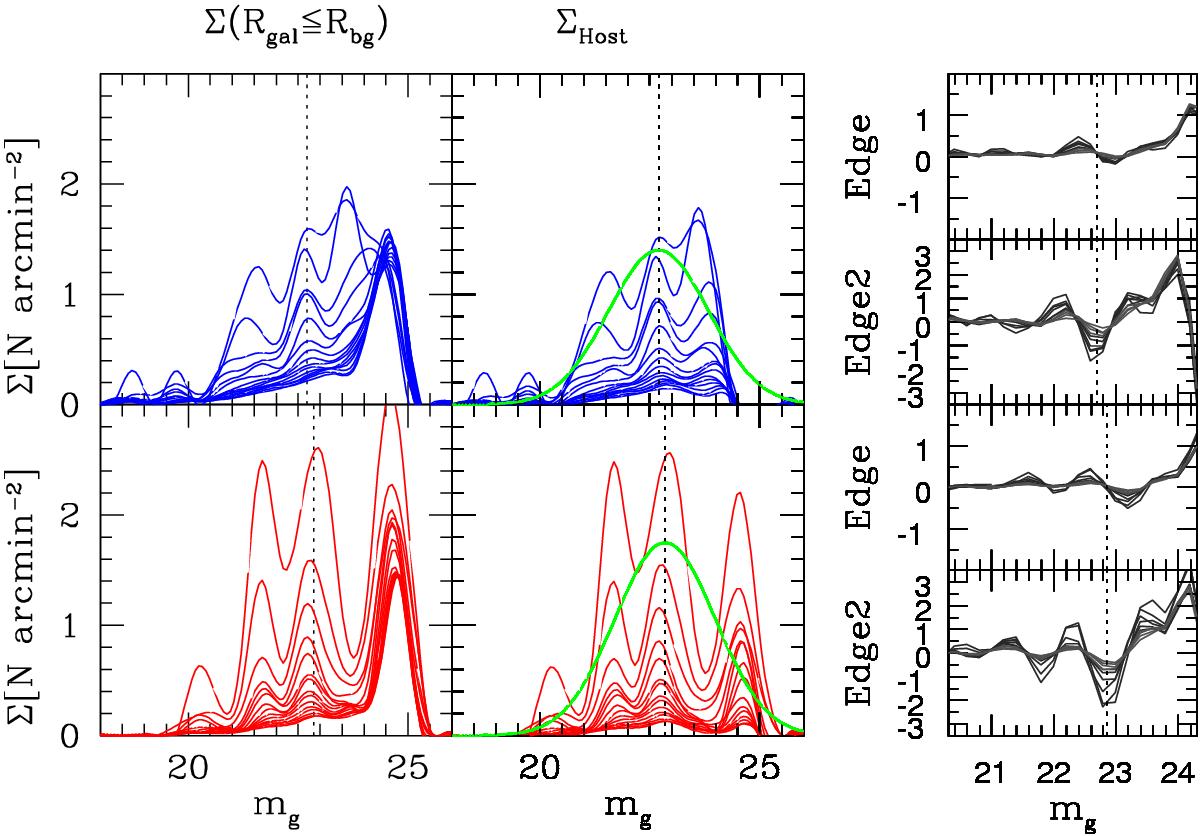
GCLF for the blue and red GC components analyzed separately. The upper panels, from left to right, show the total density distribution Σ(Rgal ≤ Rbg), the density after subtracting for background contamination ΣHost, and the edge and edge2 functions. The vertical dashed line marks the approximate position of the TOM, as obtained from the edge functions. The green line shows a Gaussian with peak at ![]() mag. Lower panels: as upper ones, but for the red GC components, with
mag. Lower panels: as upper ones, but for the red GC components, with ![]() mag.
mag.
Current usage metrics show cumulative count of Article Views (full-text article views including HTML views, PDF and ePub downloads, according to the available data) and Abstracts Views on Vision4Press platform.
Data correspond to usage on the plateform after 2015. The current usage metrics is available 48-96 hours after online publication and is updated daily on week days.
Initial download of the metrics may take a while.