Fig. 7
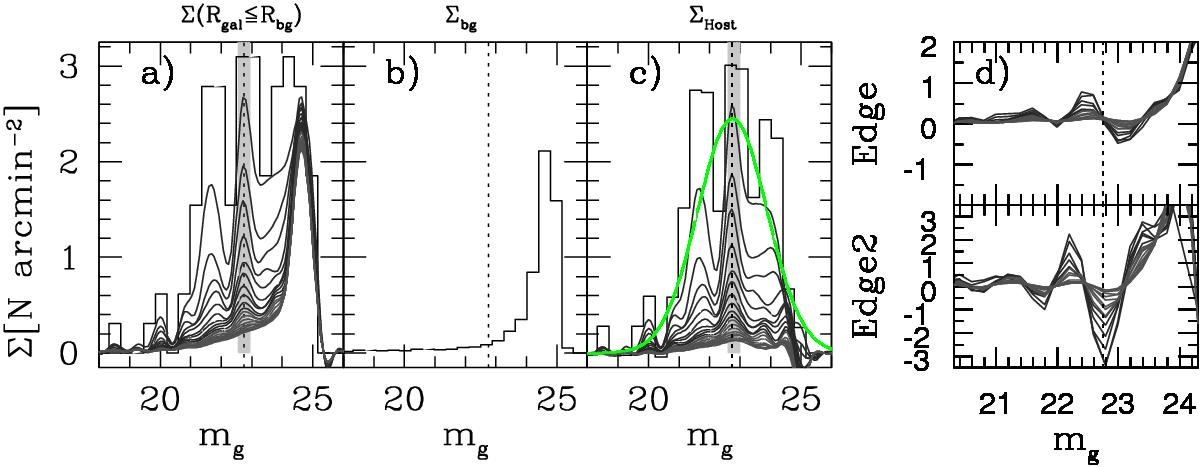
Surface density histograms versus magnitude. Panels a) to c): as in Fig. 4, but magnitude is used instead of color. The vertical dotted line shows the position of the TOM. The ~0.2 mag tolerance for the peak position (gray shaded area) is also shown as well as the best-fit Gaussian to the GCLF (green line; ![]() mag, σTOM = 1.14). Panel d): edge and second-run edge (Edge2) functions.
mag, σTOM = 1.14). Panel d): edge and second-run edge (Edge2) functions.
Current usage metrics show cumulative count of Article Views (full-text article views including HTML views, PDF and ePub downloads, according to the available data) and Abstracts Views on Vision4Press platform.
Data correspond to usage on the plateform after 2015. The current usage metrics is available 48-96 hours after online publication and is updated daily on week days.
Initial download of the metrics may take a while.