Fig. 6
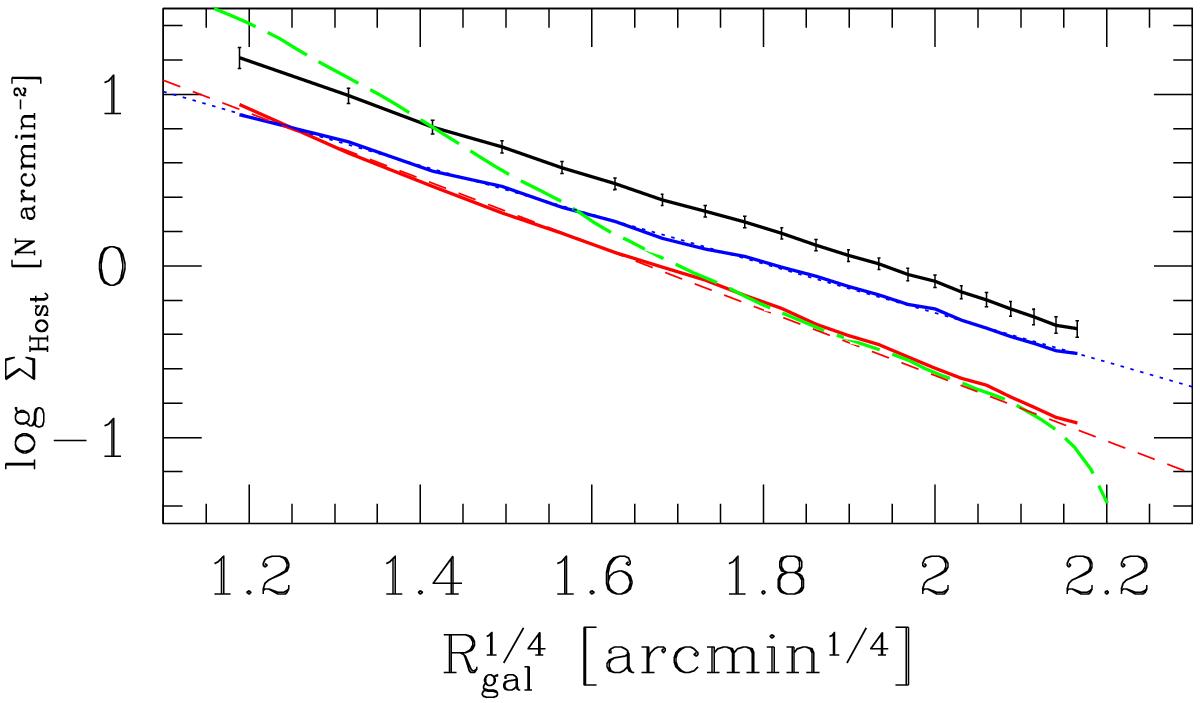
Surface density profiles of blue, red, and total GC population (blue, red and black lines, respectively). The galaxy surface brightness profile in g band from Capaccioli et al. (in prep.) is also reported with green long-dashed line. The linear fit to the surface density is shown with dotted lines (blue-dotted, red-dashed for the blue and red GCs). The scale of the galaxy profile is arbitrary.
Current usage metrics show cumulative count of Article Views (full-text article views including HTML views, PDF and ePub downloads, according to the available data) and Abstracts Views on Vision4Press platform.
Data correspond to usage on the plateform after 2015. The current usage metrics is available 48-96 hours after online publication and is updated daily on week days.
Initial download of the metrics may take a while.