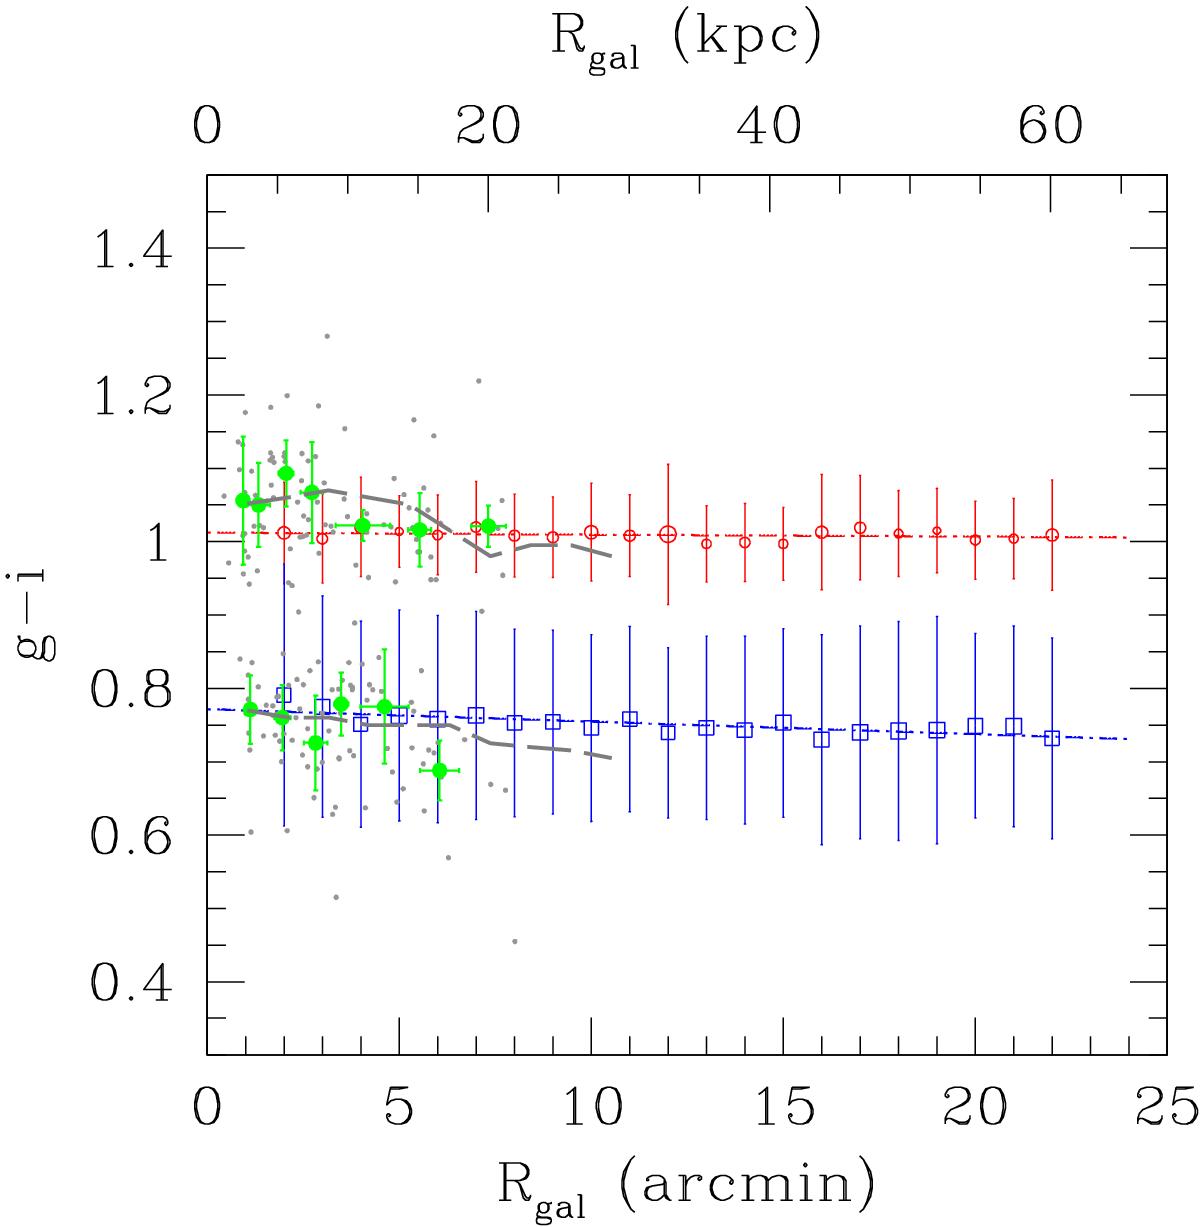
Fig. 5

Position and width of the blue and red GCs (blue squares and red empty circles) at different Rgal as obtained from GMM. Symbol size is proportional to the fraction of objects associated with each peak. A fit to the data is shown with dot-dashed lines for the two subpopulations. Gray dots show spectroscopic confirmed GCs from Arnold et al. (2011). Full green points mark the running mean (median from equal number of data) of gray points. Gray long-dashed lines mark the rolling fits of the blue and red GC peaks as derived by Arnold et al. (2011) obtained from a combination of spectroscopically and photometrically selected GCs.
Current usage metrics show cumulative count of Article Views (full-text article views including HTML views, PDF and ePub downloads, according to the available data) and Abstracts Views on Vision4Press platform.
Data correspond to usage on the plateform after 2015. The current usage metrics is available 48-96 hours after online publication and is updated daily on week days.
Initial download of the metrics may take a while.


