Fig. 4
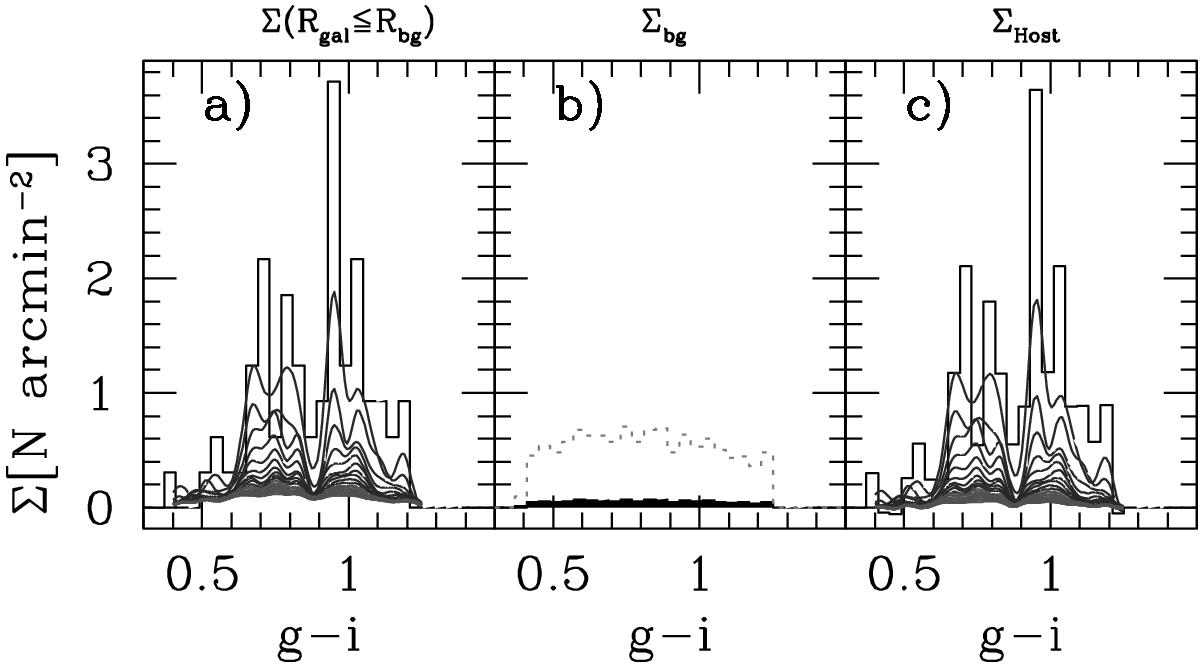
Surface density histograms versus color. Panel a) Surface density for sources within Rgal ≤ Rbg. Darker color refers to areas with smaller galactocentric radii. Panel b) same as left, but for background sources at Rgal>Rbg. For the sake of clarity, the dotted histogram shows the density histogram times a factor 10. Panel c) residual surface density, Σ(Rgal ≤ Rbg) − Σbg.
Current usage metrics show cumulative count of Article Views (full-text article views including HTML views, PDF and ePub downloads, according to the available data) and Abstracts Views on Vision4Press platform.
Data correspond to usage on the plateform after 2015. The current usage metrics is available 48-96 hours after online publication and is updated daily on week days.
Initial download of the metrics may take a while.