Free Access
Fig. 3
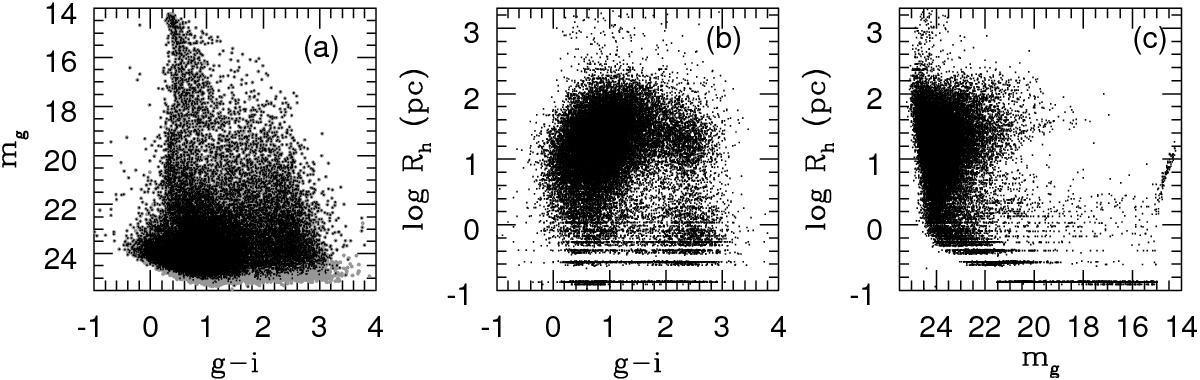
Photometry and sizes of SSS candidates in NGC 3115. Panel a) color–magnitude diagram for the full sample of g and i matched sources (gray dots) and for the sources with size estimates (black points). Panel b) apparent size-versus-color diagram. Panel c) apparent size-versus-magnitude diagram.
Current usage metrics show cumulative count of Article Views (full-text article views including HTML views, PDF and ePub downloads, according to the available data) and Abstracts Views on Vision4Press platform.
Data correspond to usage on the plateform after 2015. The current usage metrics is available 48-96 hours after online publication and is updated daily on week days.
Initial download of the metrics may take a while.