Fig. C.1
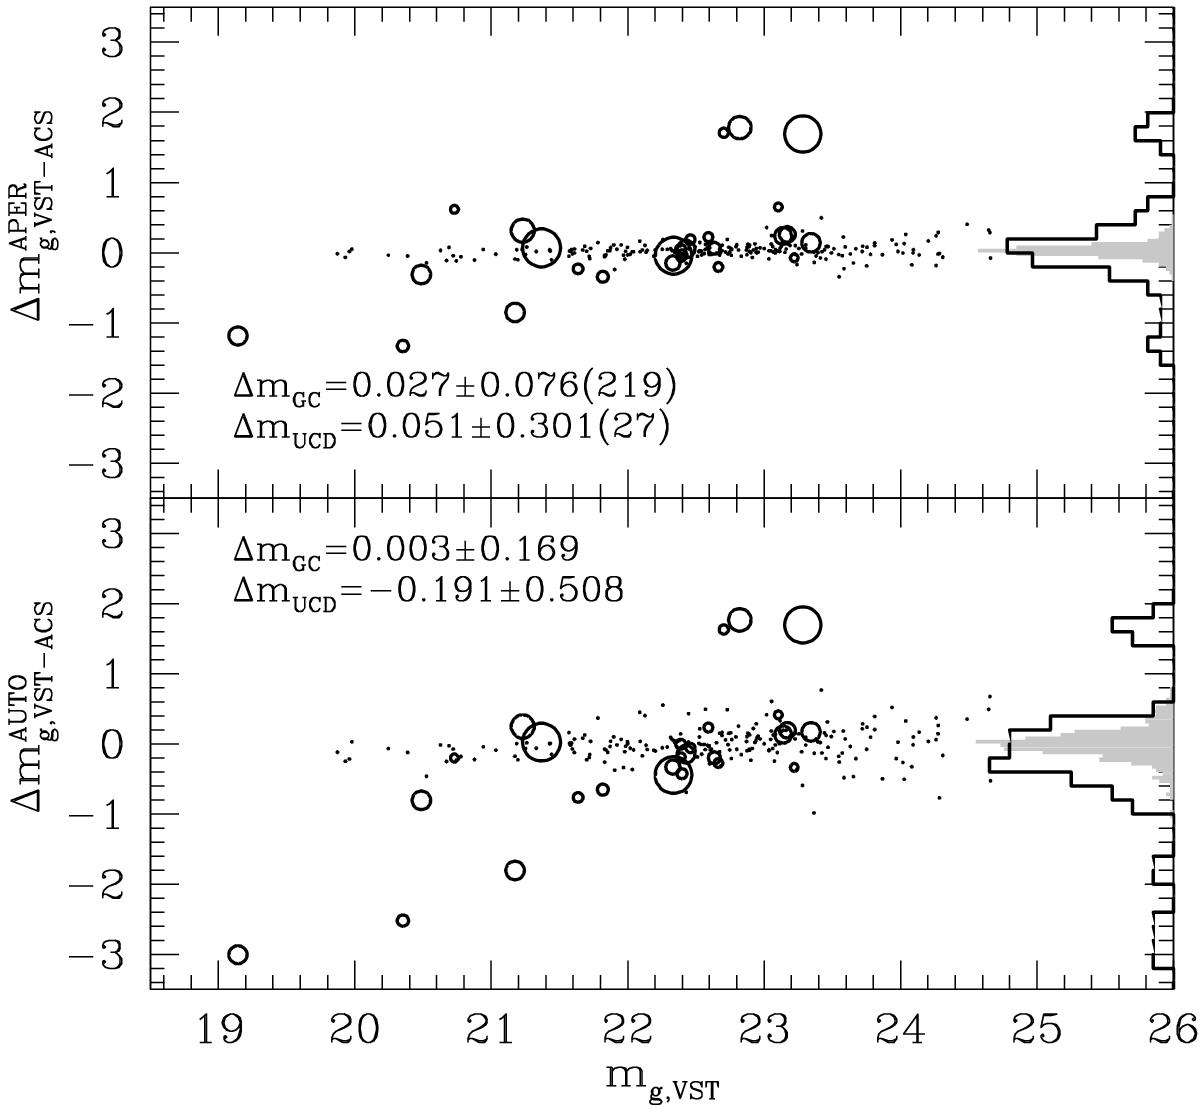
Upper panel: comparison of ACS and VEGAS-SSS aperture-corrected magnitudes for the GCs and UCDs. Dots and shaded histogram refer to GCs, UCDs are shown with empty circles (with symbol size scaled to Rh) and thick solid line histogram. The number of matched sources is reported together with the median and rms of the VEGAS-SSS to ACS mg difference. Lower panel: as upper, but the SExtractor AUTO magnitude is used for both GCs and UCDs.
Current usage metrics show cumulative count of Article Views (full-text article views including HTML views, PDF and ePub downloads, according to the available data) and Abstracts Views on Vision4Press platform.
Data correspond to usage on the plateform after 2015. The current usage metrics is available 48-96 hours after online publication and is updated daily on week days.
Initial download of the metrics may take a while.