Free Access
Fig. B.1
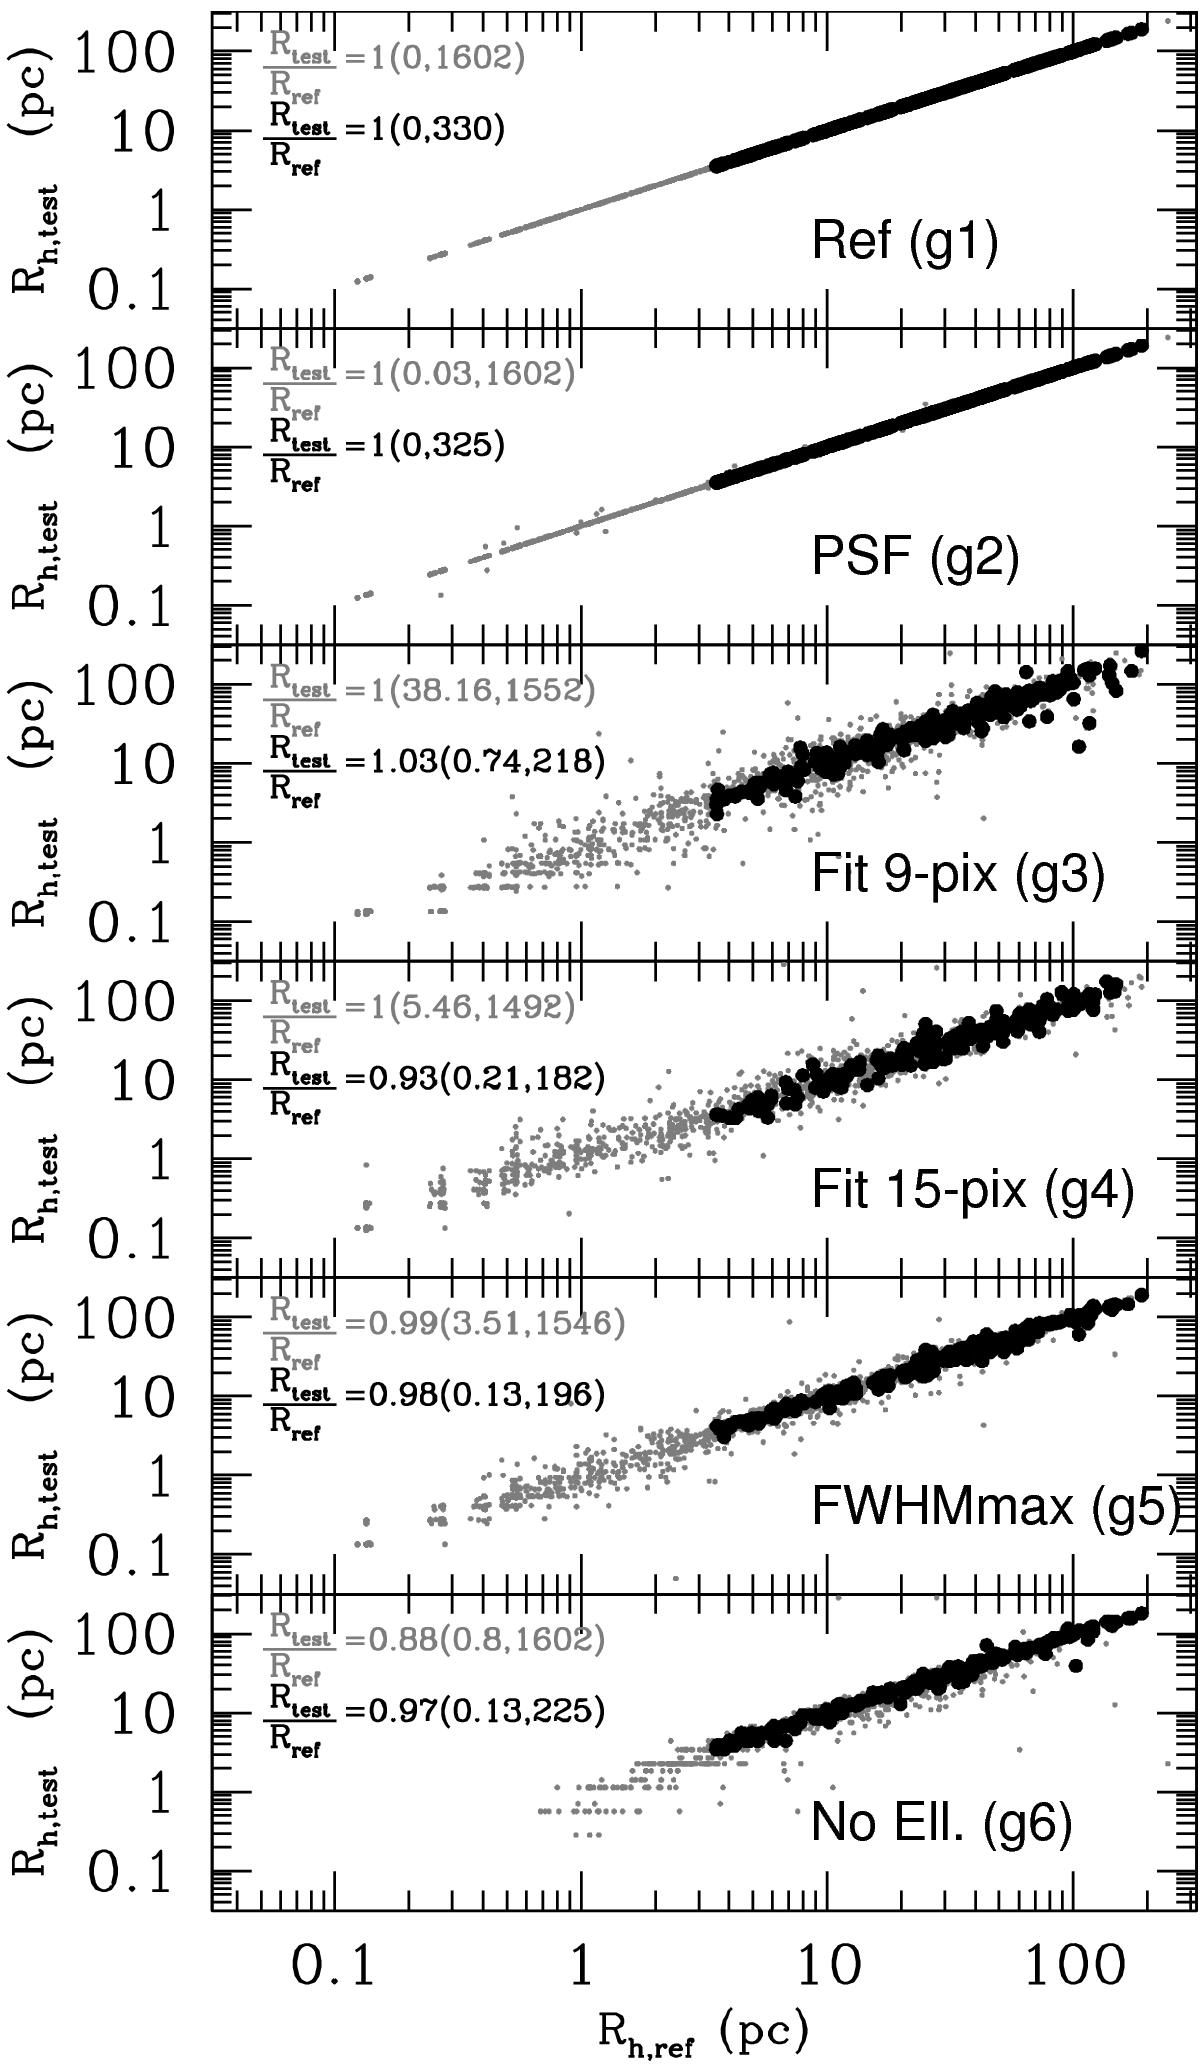
Comparison of effective radii with different Ishape input parameters. Gray circles refer to the full list of matched sources, black dots to the reference sample. The numbers in each panel show the median Rh,test/Rh,ref ratio, with the rmsMAD and the number of objects used in parenthesis, labels are color coded.
Current usage metrics show cumulative count of Article Views (full-text article views including HTML views, PDF and ePub downloads, according to the available data) and Abstracts Views on Vision4Press platform.
Data correspond to usage on the plateform after 2015. The current usage metrics is available 48-96 hours after online publication and is updated daily on week days.
Initial download of the metrics may take a while.