Fig. A.2
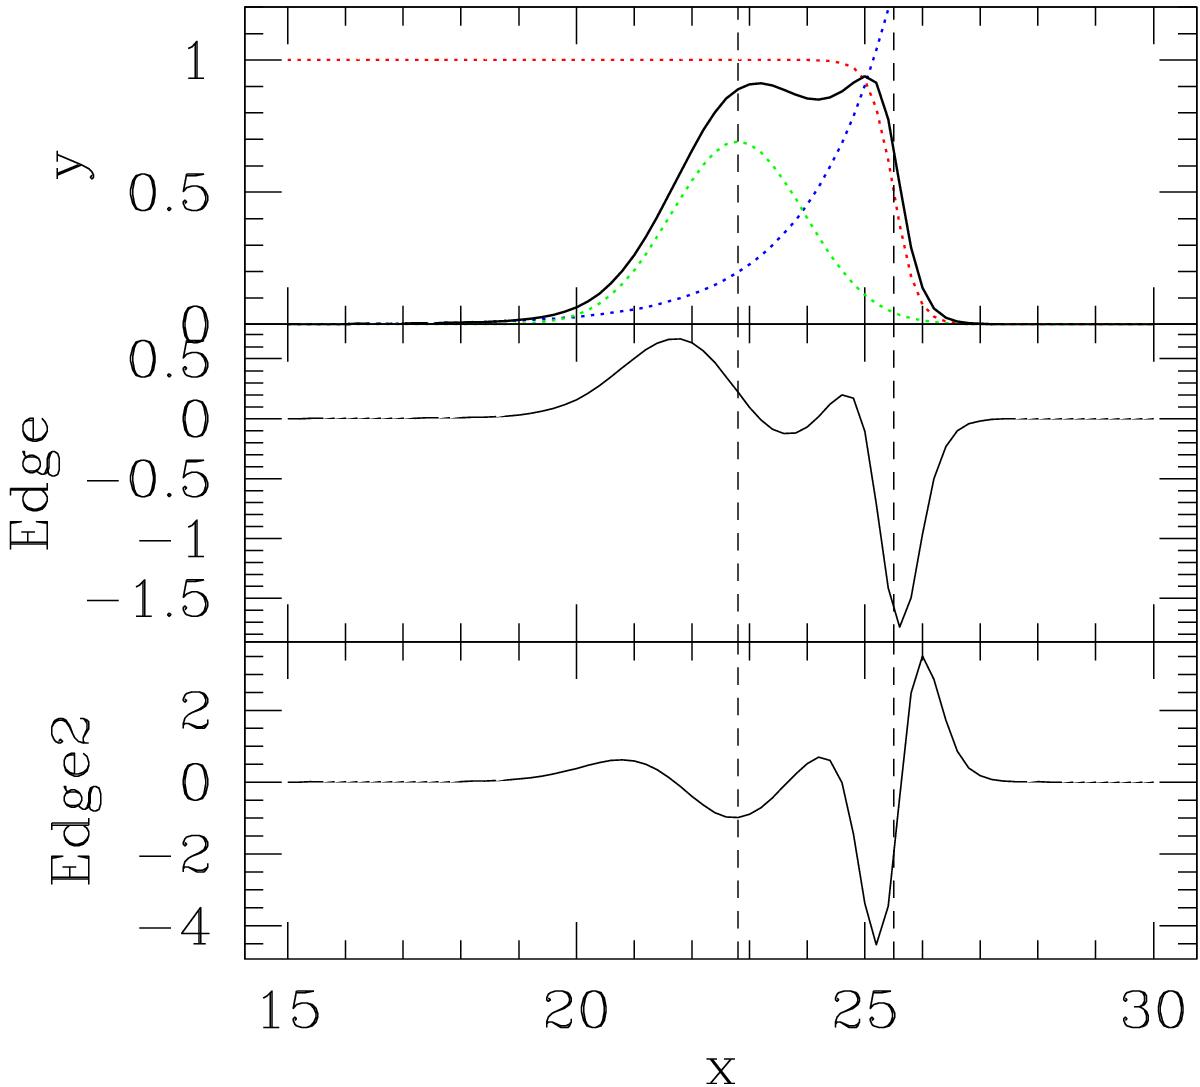
Upper panel: analytic GCLF (green line), background galaxies (blue), and completeness function (red) are combined in the total expected total luminosity function (black solid line). The GCLF peak (at x = 22.8) and 50% completeness limit (at x = 25.5) are shown with dashed vertical lines. Middle panel: edge detection function applied to the analytical formula of the total luminosity function. Lower panel: second-run edge detection.
Current usage metrics show cumulative count of Article Views (full-text article views including HTML views, PDF and ePub downloads, according to the available data) and Abstracts Views on Vision4Press platform.
Data correspond to usage on the plateform after 2015. The current usage metrics is available 48-96 hours after online publication and is updated daily on week days.
Initial download of the metrics may take a while.