Fig. 14
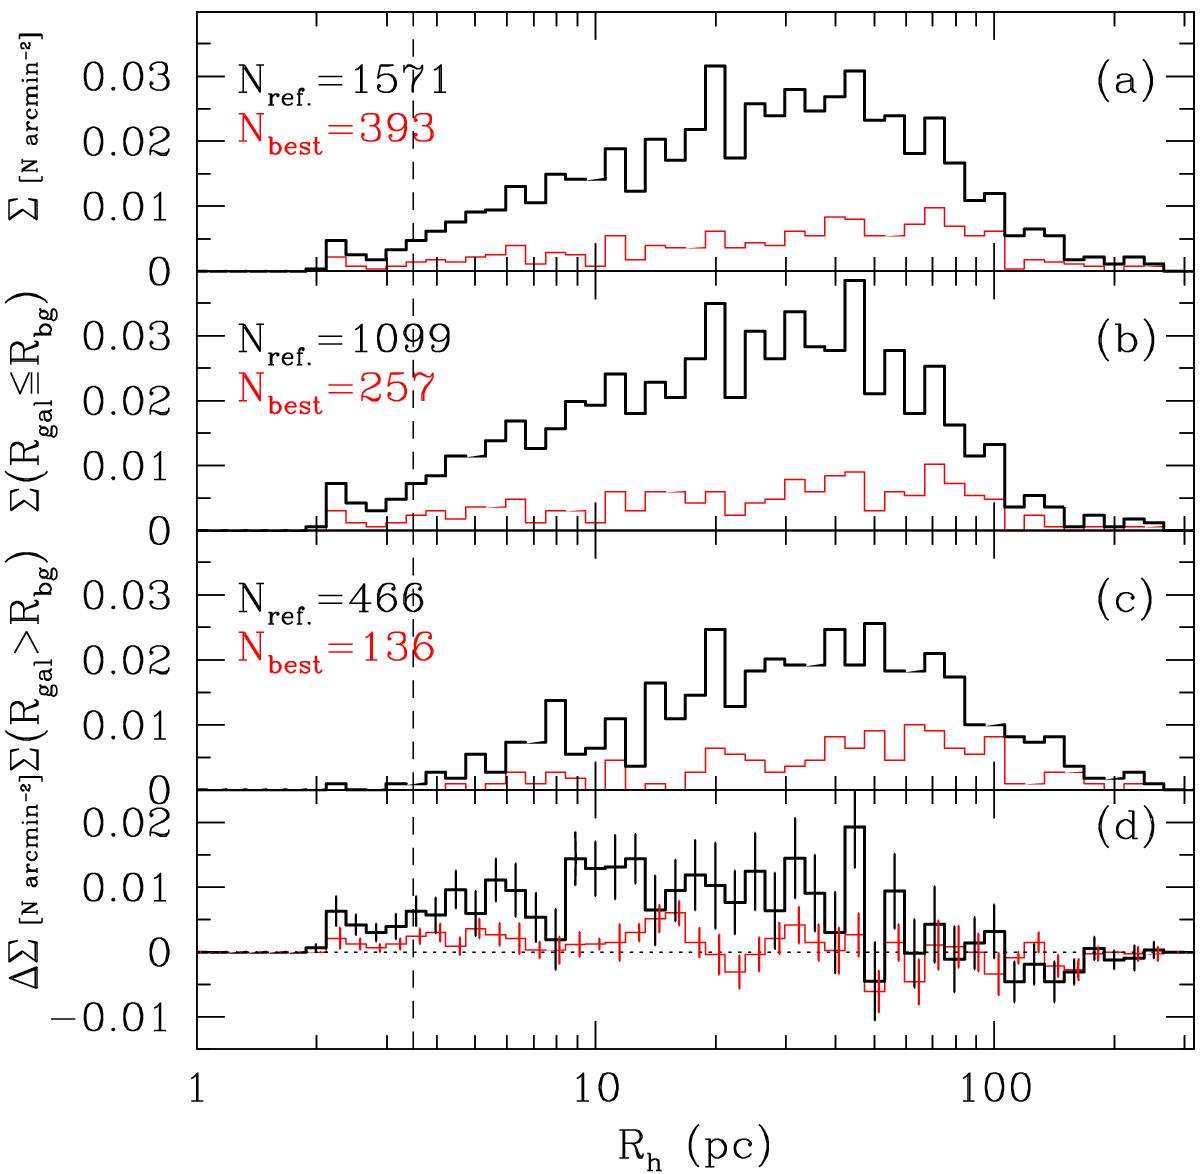
Rh surface density distribution for the reference sample (black lines) and for the best sample (in red, Σ in units of number of objects per square arcminute). The panels, from upper to lower, show the surface density over the full inspected frame for sources at Rgal ≤ Rbg for the background area at Rgal>Rbg, and for the difference between the inner and outer 23′. The vertical dashed line marks the 3.5 pc limit.
Current usage metrics show cumulative count of Article Views (full-text article views including HTML views, PDF and ePub downloads, according to the available data) and Abstracts Views on Vision4Press platform.
Data correspond to usage on the plateform after 2015. The current usage metrics is available 48-96 hours after online publication and is updated daily on week days.
Initial download of the metrics may take a while.