Fig. 13
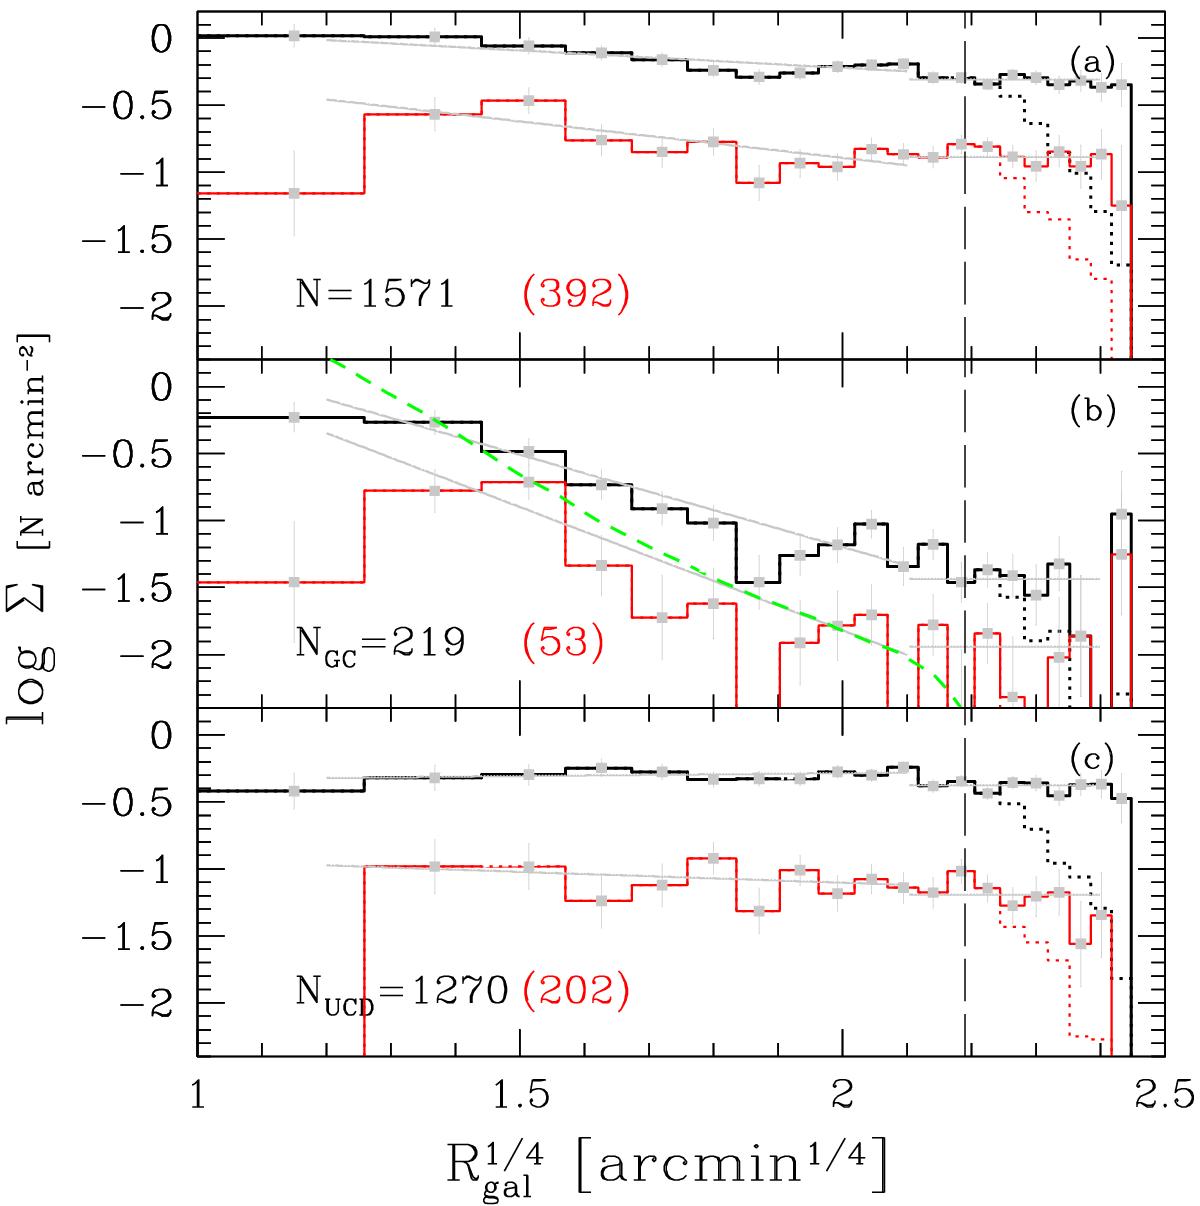
Radial surface density distribution of sources in the reference (black histograms) and best (red histogram) samples. Panel a) all Rh values are taken. The r1/4 fit to data is shown with gray lines. The dotted lines show the histograms without correction for areal coverage. The vertical long-dashed line is the position of limiting galactocentric radius Rbg. Panel b) as upper, but only GC candidates are plotted. The green-dashed line shows the galaxy surface brightness (from Capaccioli et al., in prep., g band, arbitrary scale). Panel c) as panel a), but for UCD candidates.
Current usage metrics show cumulative count of Article Views (full-text article views including HTML views, PDF and ePub downloads, according to the available data) and Abstracts Views on Vision4Press platform.
Data correspond to usage on the plateform after 2015. The current usage metrics is available 48-96 hours after online publication and is updated daily on week days.
Initial download of the metrics may take a while.