Fig. 12
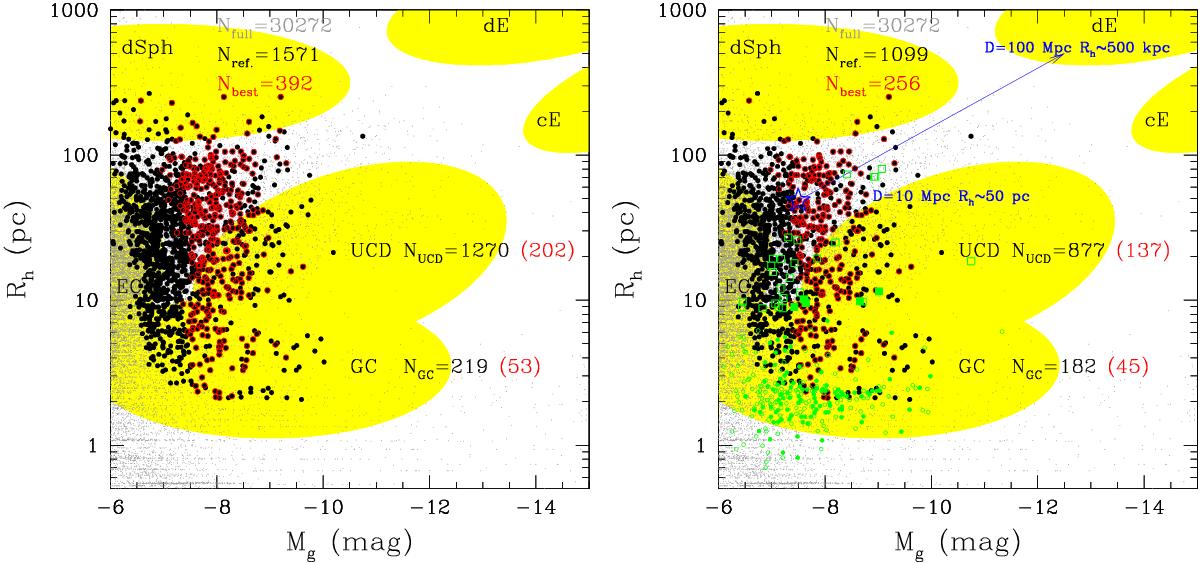
Magnitude-size diagram. Left panel: magnitude versus effective radius for the VEGAS-SSS field centered on NGC 3115. Color-coding for black and gray dots is as in previous figures, with the addition of the best sample selection (red empty circles). Yellow regions show the mean loci of the labeled SSS classes. The number of UCD and GC candidates, NUCD and NGC, for the reference and best sample (given in parenthesis) are also reported. Right panel: as left panel, but only sources with Rgal ≤ Rbg are plotted. The blue arrow shows the direction in which the points are shifted if the object lies at larger distance. We included the ACS sample using green symbols: GCs shown with circles, UCDs with squares. For the ACS sample, spectroscopically confirmed GCs from Arnold et al. (2011) are plotted as solid symbols.
Current usage metrics show cumulative count of Article Views (full-text article views including HTML views, PDF and ePub downloads, according to the available data) and Abstracts Views on Vision4Press platform.
Data correspond to usage on the plateform after 2015. The current usage metrics is available 48-96 hours after online publication and is updated daily on week days.
Initial download of the metrics may take a while.