Fig. 11
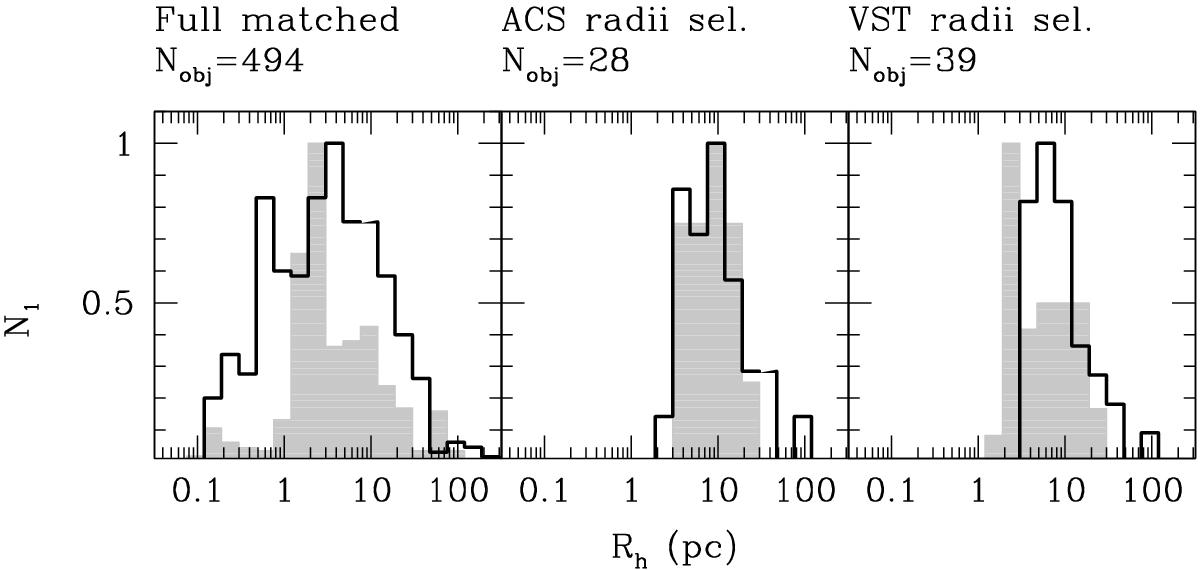
Rh distribution for ACS and VEGAS-SSS samples. From left to right: Rh distribution for the full list of matched ACS and VEGAS-SSS sources, for the sample selected using Rh,ACS, and for the sample selected using Rh,VST (see text). Shaded histograms refer to Rh,ACS distributions, solid thick lines to Rh,VST. All histograms are normalized to one at peak value.
Current usage metrics show cumulative count of Article Views (full-text article views including HTML views, PDF and ePub downloads, according to the available data) and Abstracts Views on Vision4Press platform.
Data correspond to usage on the plateform after 2015. The current usage metrics is available 48-96 hours after online publication and is updated daily on week days.
Initial download of the metrics may take a while.