Fig. 10
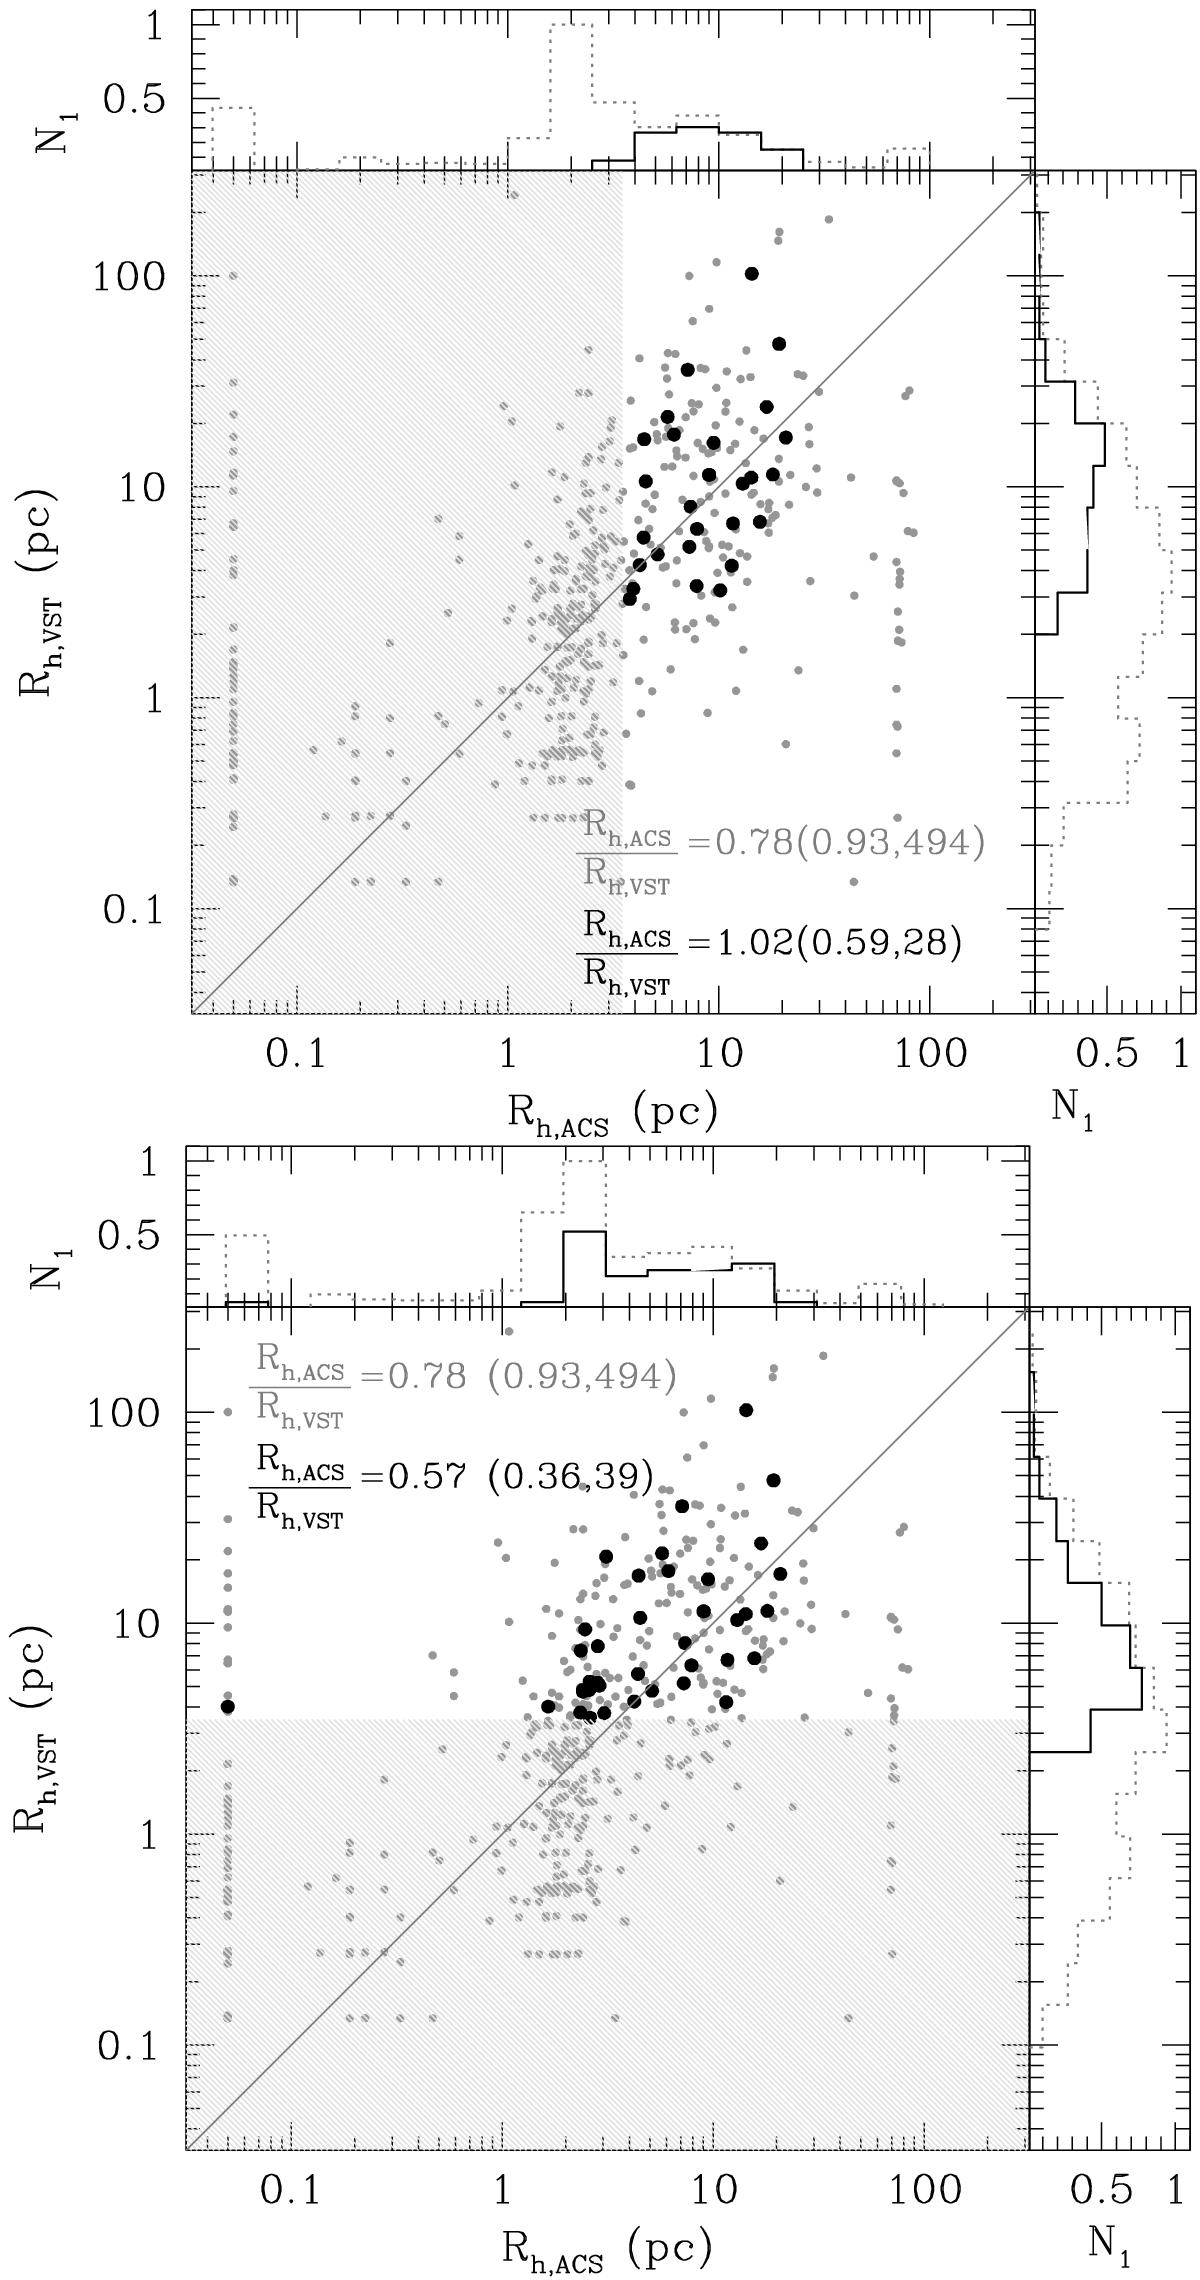
Size comparison between VEGAS-SSS and ACS. Left panels: effective radii for objects common to the ACS and VEGAS-SSS catalogs (full sample with gray dots, reference sample with black circles). For each sample, the median ratio between the ACS and VEGAS-SSS Rh is reported, the rmsMAD and the number of sources used are given in parentheses. The histograms shown in the upper and right insets use the same color coding as the central panel and are normalized to 1 at peak value for the full sample. The effective radii from ACS data are used for the selection (unshaded area). The diagonal line represents the 1:1 relation. Right panels: as left panels, but the selection is based on Rh from VEGAS-SSS.
Current usage metrics show cumulative count of Article Views (full-text article views including HTML views, PDF and ePub downloads, according to the available data) and Abstracts Views on Vision4Press platform.
Data correspond to usage on the plateform after 2015. The current usage metrics is available 48-96 hours after online publication and is updated daily on week days.
Initial download of the metrics may take a while.