Fig. 6
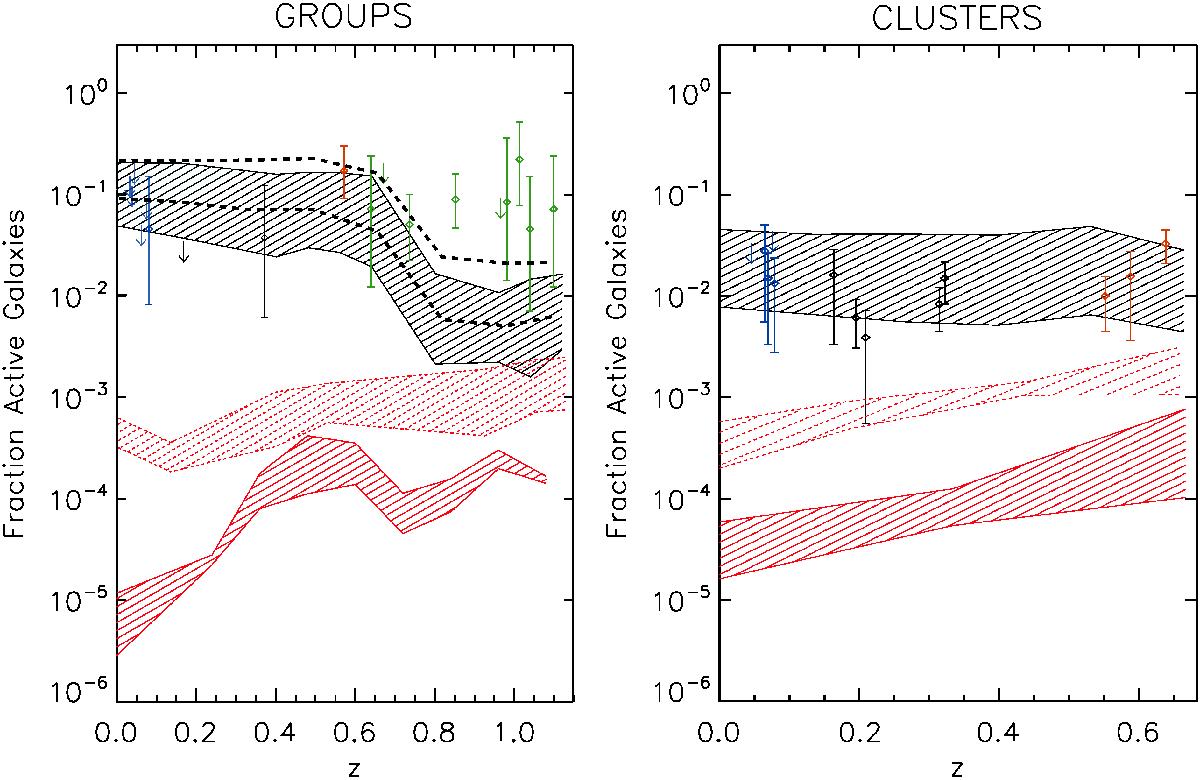
Predicted AGN fraction in groups (1013.5<M< 1014.3M⊙, left panel) and clusters (M> 1014.5M⊙, right panel) for AGN LX> 1042 erg s-1, hosted by galaxies brighter than MR< − 20. The predictions of our model are represented by shaded regions: black for IT and red for the fiducial case for DI. The shaded region with red-dashed lines represents the prediction for the DI scenario with decreased normalization α = 2, the two black-dashed lines in the groups plot represent the limits of the prediction for the IT scenario obtained with a slightly brighter threshold for galaxies (MR< − 21, see text for more details). Green symbols are data from Pentericci et al. (2013), red symbol from Eastman et al. (2007), black symbols from Martini et al. (2009), and blue symbols from Arnold et al. (2009). Uncertainties and upper limits are computed by using the low-number statistics estimator (at 1σ) by Gehrals (1986).
Current usage metrics show cumulative count of Article Views (full-text article views including HTML views, PDF and ePub downloads, according to the available data) and Abstracts Views on Vision4Press platform.
Data correspond to usage on the plateform after 2015. The current usage metrics is available 48-96 hours after online publication and is updated daily on week days.
Initial download of the metrics may take a while.