Fig. 4
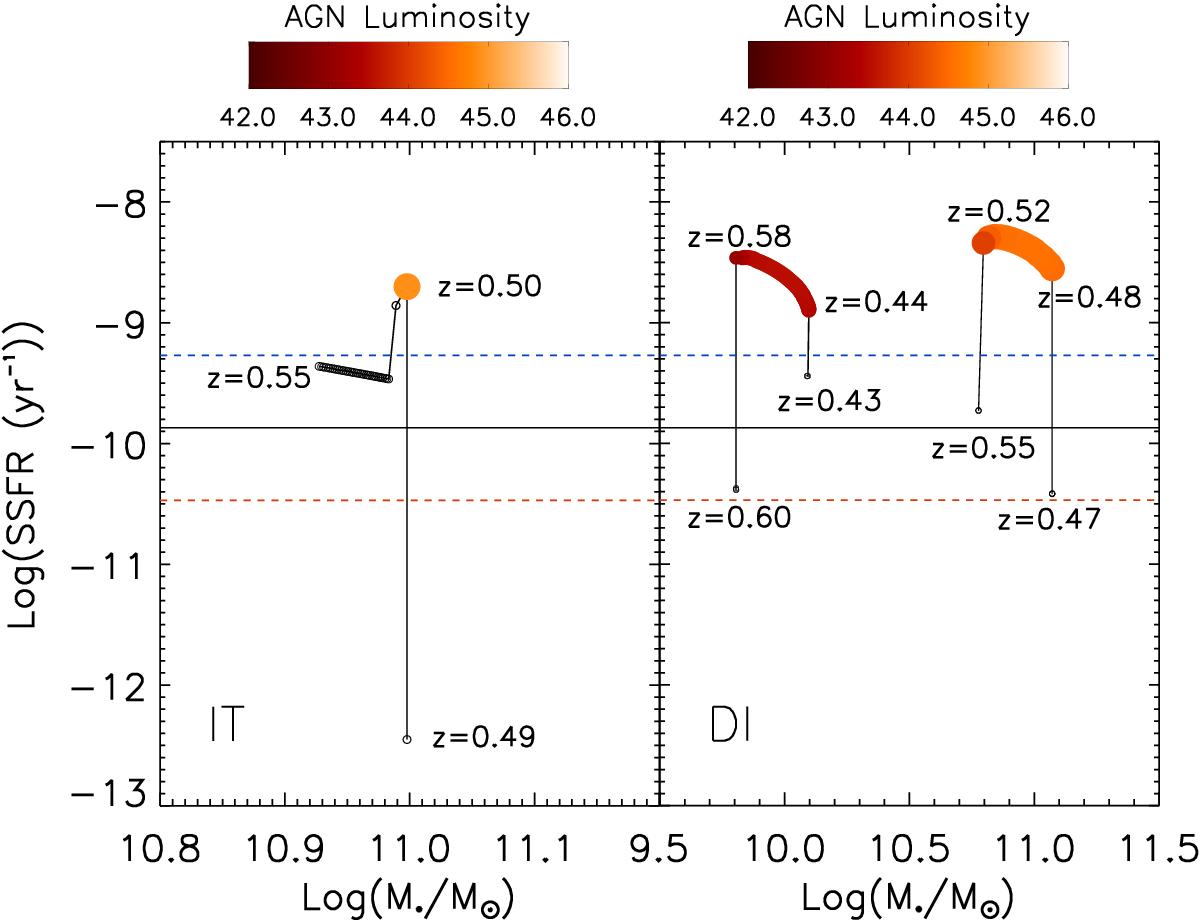
Path followed by typical AGN hosts in the SSFR − M∗ plane. The left panel refers to the IT scenario, the right panels to the DI mode. The main sequence computed from the model is represented by the black line (computed in the redshift range 0.5 <z< 0.8), while the blue and the red dotted lines mark the separation between the main sequence and the starburst/passive region. The position of AGN hosts is represented by a circle; if the circle is black, no AGN activity is present in the host, or AGN luminosity is below the threshold (LX> 1042 erg s-1). AGN activity above the threshold is represented by a coloured circle (the colour code is shown above each plot, and the AGN luminosity refers to X-ray luminosity in the 2−10 keV band). We also show the corresponding redshift near some circles; the hosts have been selected at redshift z = 0.5. At z = 0.5, AGN are characterized by luminosities Log LX = 44.9 (left panel), LogLX = 44.6 (right path, right panel) and Log LX = 43.3 (left path, right panel).
Current usage metrics show cumulative count of Article Views (full-text article views including HTML views, PDF and ePub downloads, according to the available data) and Abstracts Views on Vision4Press platform.
Data correspond to usage on the plateform after 2015. The current usage metrics is available 48-96 hours after online publication and is updated daily on week days.
Initial download of the metrics may take a while.