Fig. 1
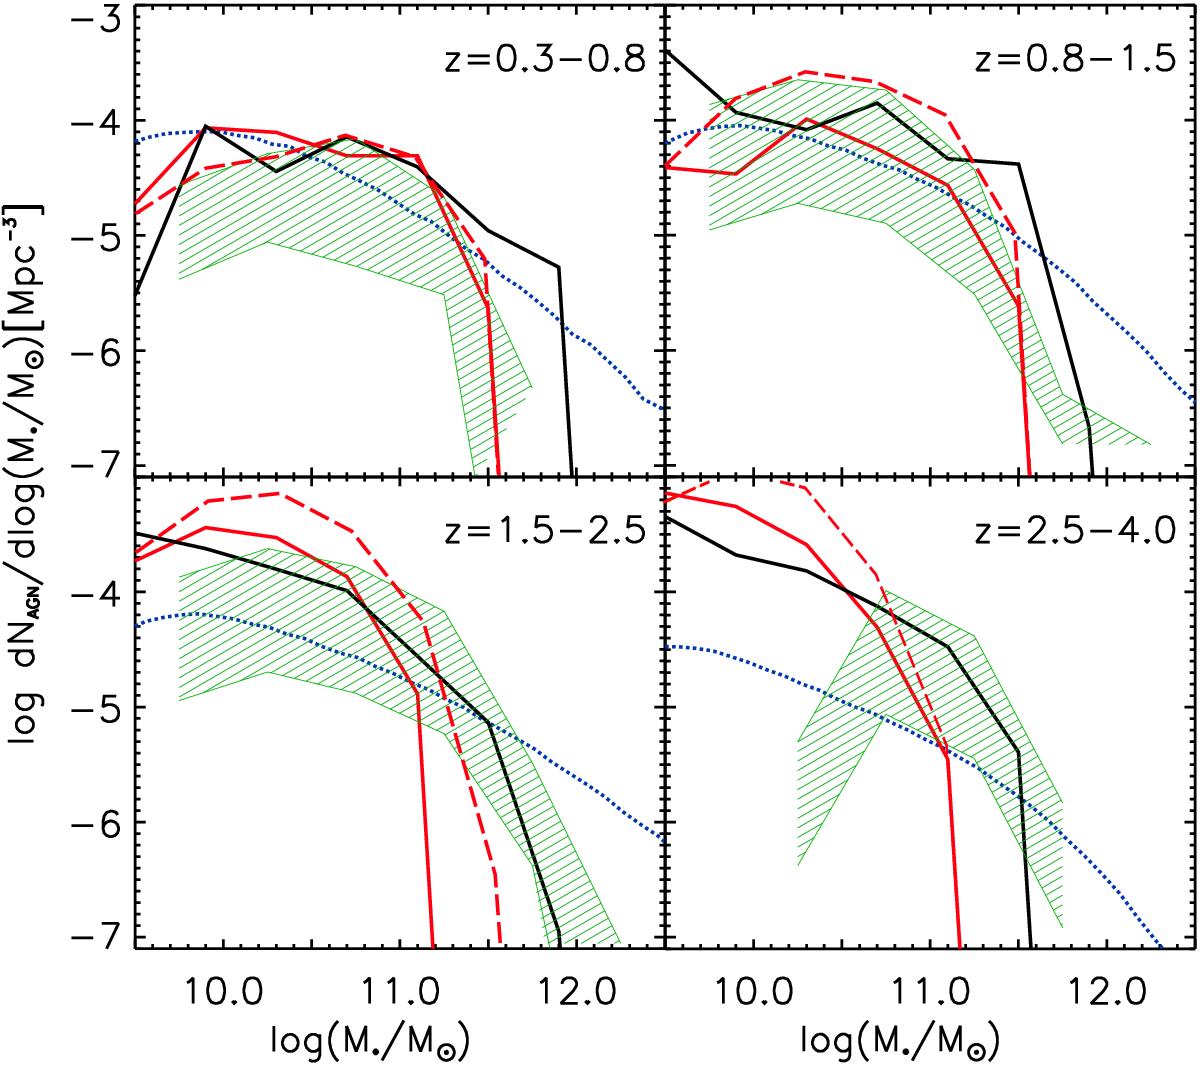
Host stellar mass function for AGN with bolometric luminosity LX> 1043 erg s-1 for four different redshift bins. For the IT scenario, the black solid line represents the host stellar mass function predicted by the model; for the DI scenario, the red solid line represents the predictions for the fiducial case (α = 10), while the red dashed line represents the case with the normalization of the accretion rate decreased (α = 2). The blue dotted line represents the host stellar mass function estimate from Fiore et al. (2012) as computed by the authors at redshift 0.75, 1.25, 2, and 3.5. The shaded region represents the observational data from Bongiorno et al. (in prep.); the contours of the region are obtained by using different assumptions about the mass incompleteness of the sample. In particular, the upper limit is obtained by assuming an Eddington ratio λ distribution for the sample described by a power law (as computed in Bongiorno et al. 2012), with a cut-off at λ ~ 1%, while the lower limit assumes the same distribution with a cut-off at λ ~ 10%.
Current usage metrics show cumulative count of Article Views (full-text article views including HTML views, PDF and ePub downloads, according to the available data) and Abstracts Views on Vision4Press platform.
Data correspond to usage on the plateform after 2015. The current usage metrics is available 48-96 hours after online publication and is updated daily on week days.
Initial download of the metrics may take a while.