Fig. 5
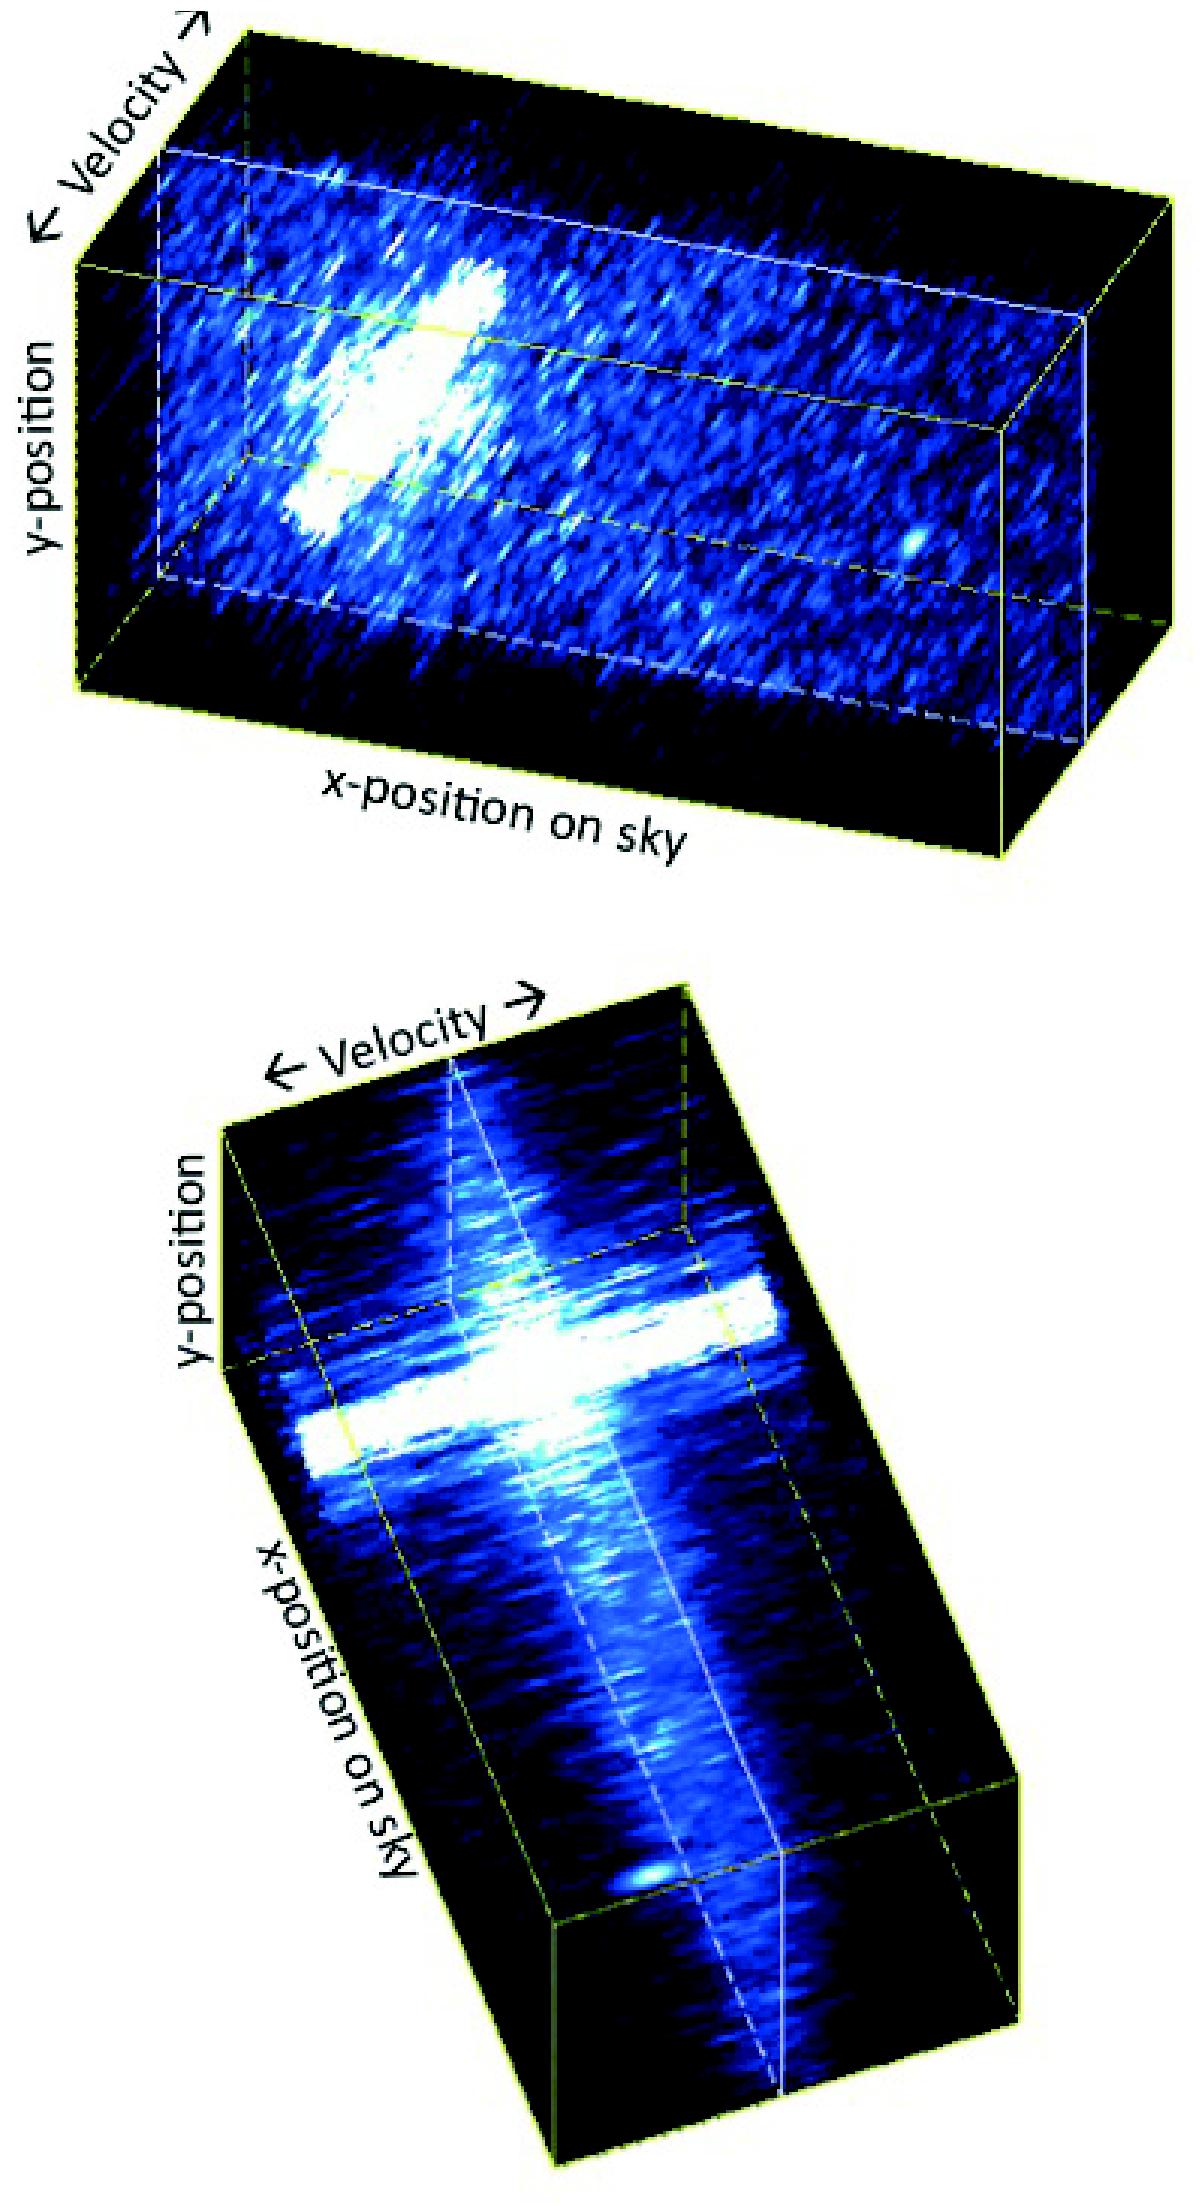
Graphical representations of the cross-correlation data cube for METIS observations. All parameters were kept the same as for the simulation presented in Sect. 4. However, for illustrative purposes, the exposure time was increased such to show the planet signal at a S/N of ~20, and the planet velocity was increased by a factor of 2 to enhance the offset in velocity space. The cross-correlation data cube is renormalized as in the bottom panel of Fig. 3. A short movie from this data cube, rotating in sky and velocity angle, is available at http://www.strw.leidenuniv.nl/~snellen/.
Current usage metrics show cumulative count of Article Views (full-text article views including HTML views, PDF and ePub downloads, according to the available data) and Abstracts Views on Vision4Press platform.
Data correspond to usage on the plateform after 2015. The current usage metrics is available 48-96 hours after online publication and is updated daily on week days.
Initial download of the metrics may take a while.