Fig. 2
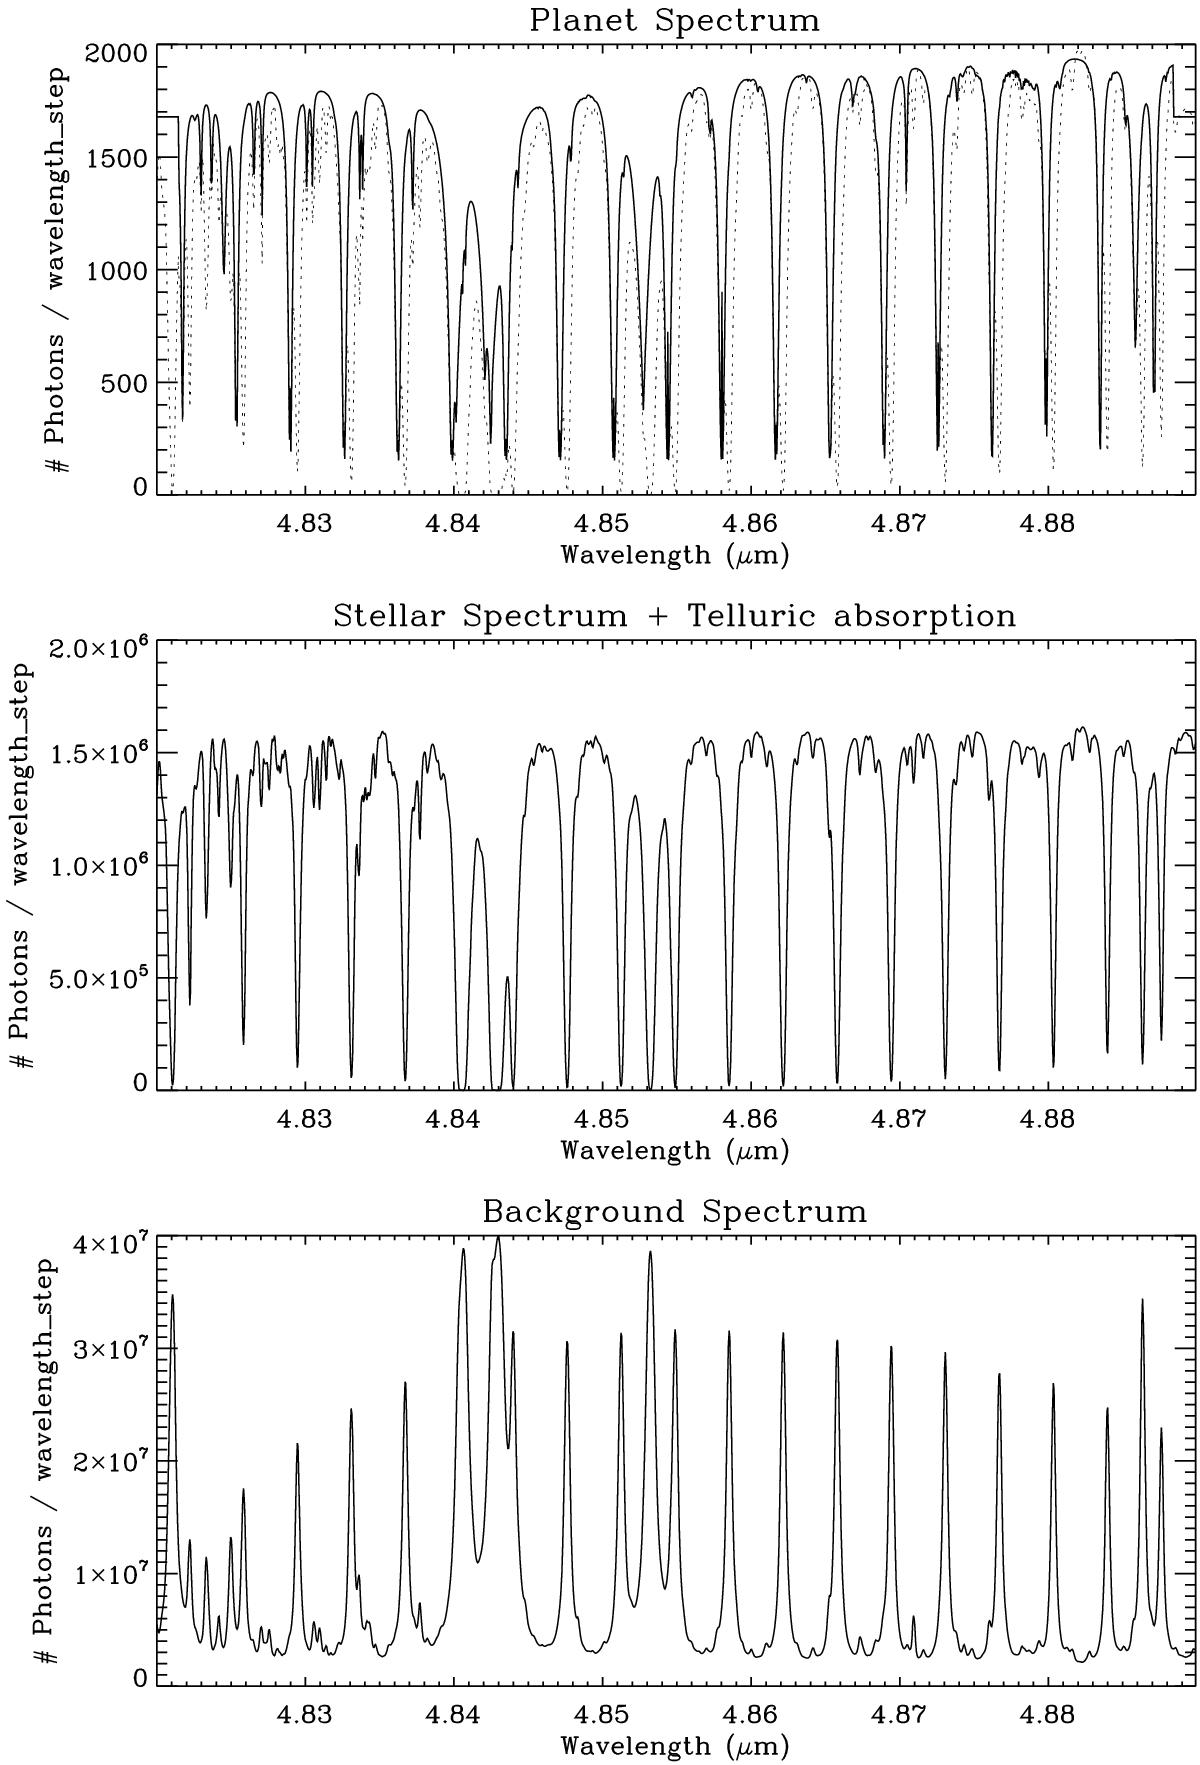
Top panel: simulated E-ELT planet spectrum as photons per Δv = 3 km s-1 wavelength interval. The dotted line indicates the Earth telluric spectrum, which in this case is very similar to the simulated thermal spectrum of the exoplanet (solid line), with the latter shifted by 30 km s-1 in velocity because of its orbital motion around α Cen A. Depending on the time of year, the telluric absorption may show an additional ±30 km s-1 velocity with respect to the exoplanet because of the Earth’s orbital velocity around the Sun. Middle panel: stellar spectrum in photons per wavelength step as seen through the Earth atmosphere, at the sky position of the planet. All the absorption lines are telluric in nature. Bottom panel: background spectrum in photons per wavelength step per pixel, modeled as contributions from the night sky and emissivity of the E-ELT. The former consists for a large part of bright emission lines at the wavelengths of the telluric absorption lines.
Current usage metrics show cumulative count of Article Views (full-text article views including HTML views, PDF and ePub downloads, according to the available data) and Abstracts Views on Vision4Press platform.
Data correspond to usage on the plateform after 2015. The current usage metrics is available 48-96 hours after online publication and is updated daily on week days.
Initial download of the metrics may take a while.