Fig. 9
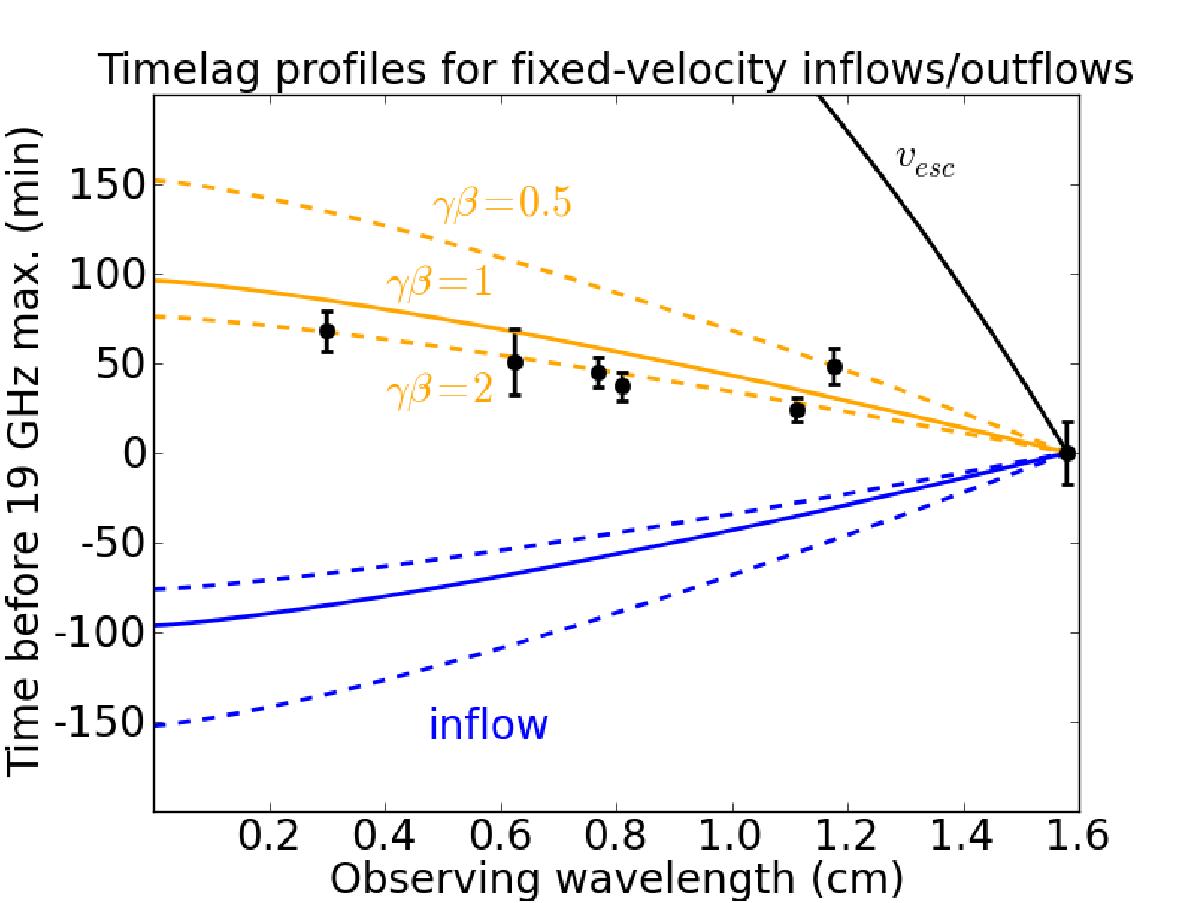
Time delays as a function of frequency, expressed in minutes before the time of maximum flux density at λ = 1.57 cm (19 GHz). Colored lines indicate the model time-lag predictions for different constant outflow and inflow velocities. Orange (light gray) lines indicate outflow, blue (dark gray) lines indicate inflow. The data points, derived from the full-data FRED curve fits, suggest an outflow with a moderately relativistic velocity, clustering around γβ = 2. This figure is valid for an inclination angle of 90 degrees and is adapted from Falcke et al. (2009).
Current usage metrics show cumulative count of Article Views (full-text article views including HTML views, PDF and ePub downloads, according to the available data) and Abstracts Views on Vision4Press platform.
Data correspond to usage on the plateform after 2015. The current usage metrics is available 48-96 hours after online publication and is updated daily on week days.
Initial download of the metrics may take a while.