Fig. 7
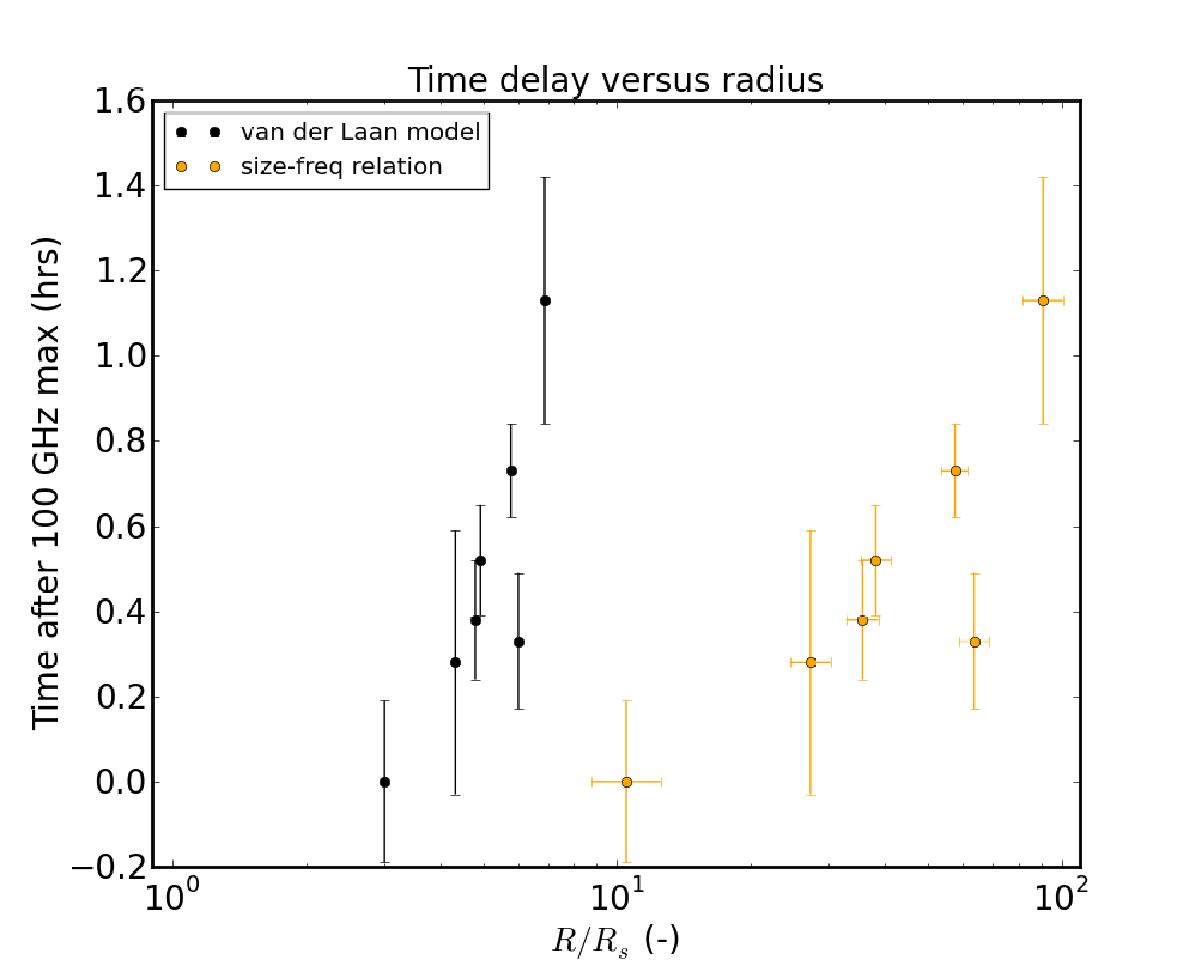
Times of flux density maxima for different frequencies plotted against the radii at which maximum flux density is reached. Black data points are obtained by combining our time lags with the outflow model used in Yusef-Zadeh et al. (2008), see also Fig. 6. If the initial radius is a only few Schwarzschild radii, the estimated flow velocity reached by the expanding plasma is on the order of 0.03c. Orange (light gray) data points are obtained by combining our time lags with the size-frequency relation (Eq. (2)), and yield a velocity of ~0.5c. Note that the initial radii are not the same for both cases.
Current usage metrics show cumulative count of Article Views (full-text article views including HTML views, PDF and ePub downloads, according to the available data) and Abstracts Views on Vision4Press platform.
Data correspond to usage on the plateform after 2015. The current usage metrics is available 48-96 hours after online publication and is updated daily on week days.
Initial download of the metrics may take a while.