Fig. 5
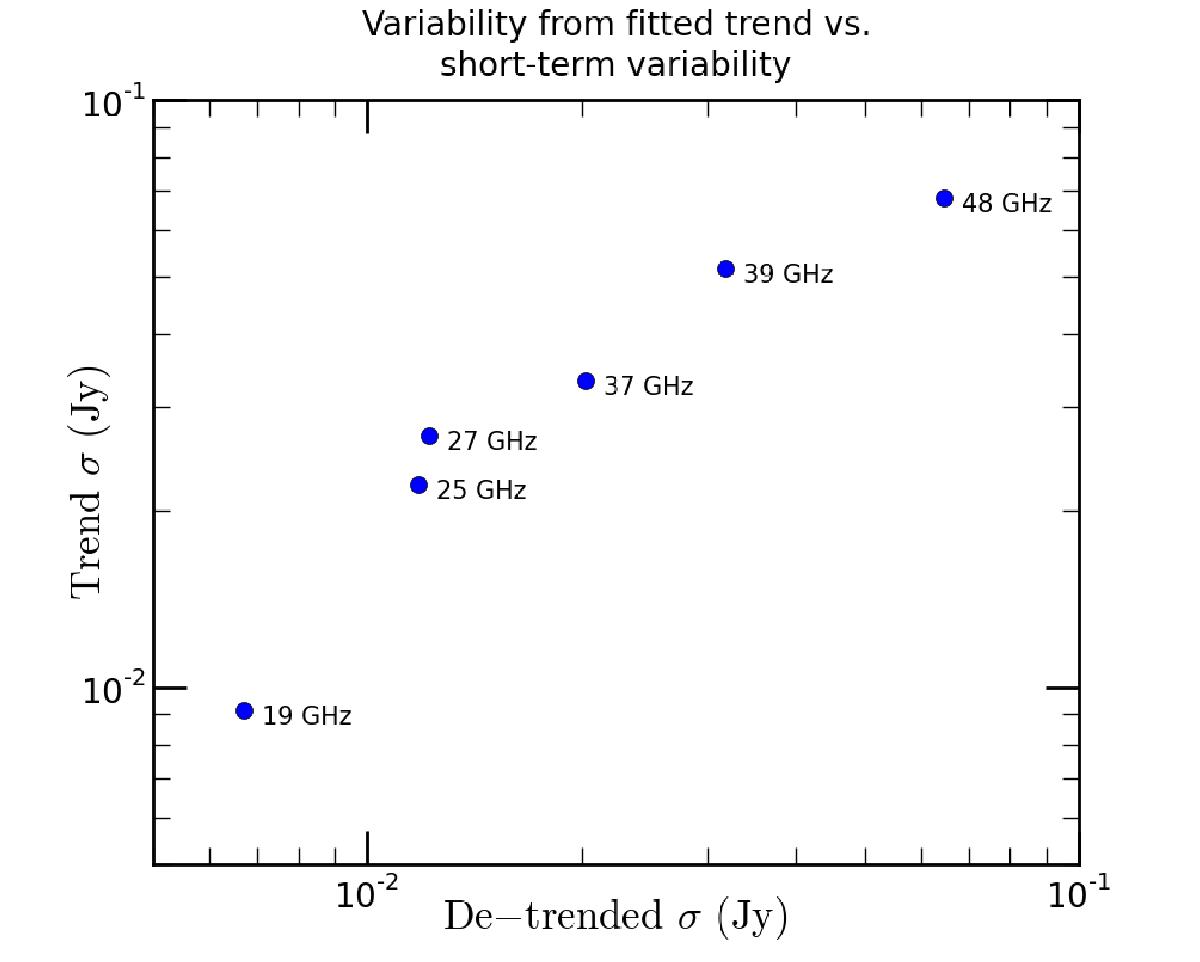
Variability due to FRED-fitted light-curve trends (vertical axis) versus remaining variability in trend-subtracted light curves (horizontal axis) for the VLA data. Both axes show standard deviations. These quantities indicate that the long-term variability that is fitted by the FRED function scales with the remaining short-term variability.
Current usage metrics show cumulative count of Article Views (full-text article views including HTML views, PDF and ePub downloads, according to the available data) and Abstracts Views on Vision4Press platform.
Data correspond to usage on the plateform after 2015. The current usage metrics is available 48-96 hours after online publication and is updated daily on week days.
Initial download of the metrics may take a while.